Immigrants from Congo vs Kiowa Associate's Degree
COMPARE
Immigrants from Congo
Kiowa
Associate's Degree
Associate's Degree Comparison
Immigrants from Congo
Kiowa
41.8%
ASSOCIATE'S DEGREE
0.5/ 100
METRIC RATING
256th/ 347
METRIC RANK
36.5%
ASSOCIATE'S DEGREE
0.0/ 100
METRIC RATING
326th/ 347
METRIC RANK
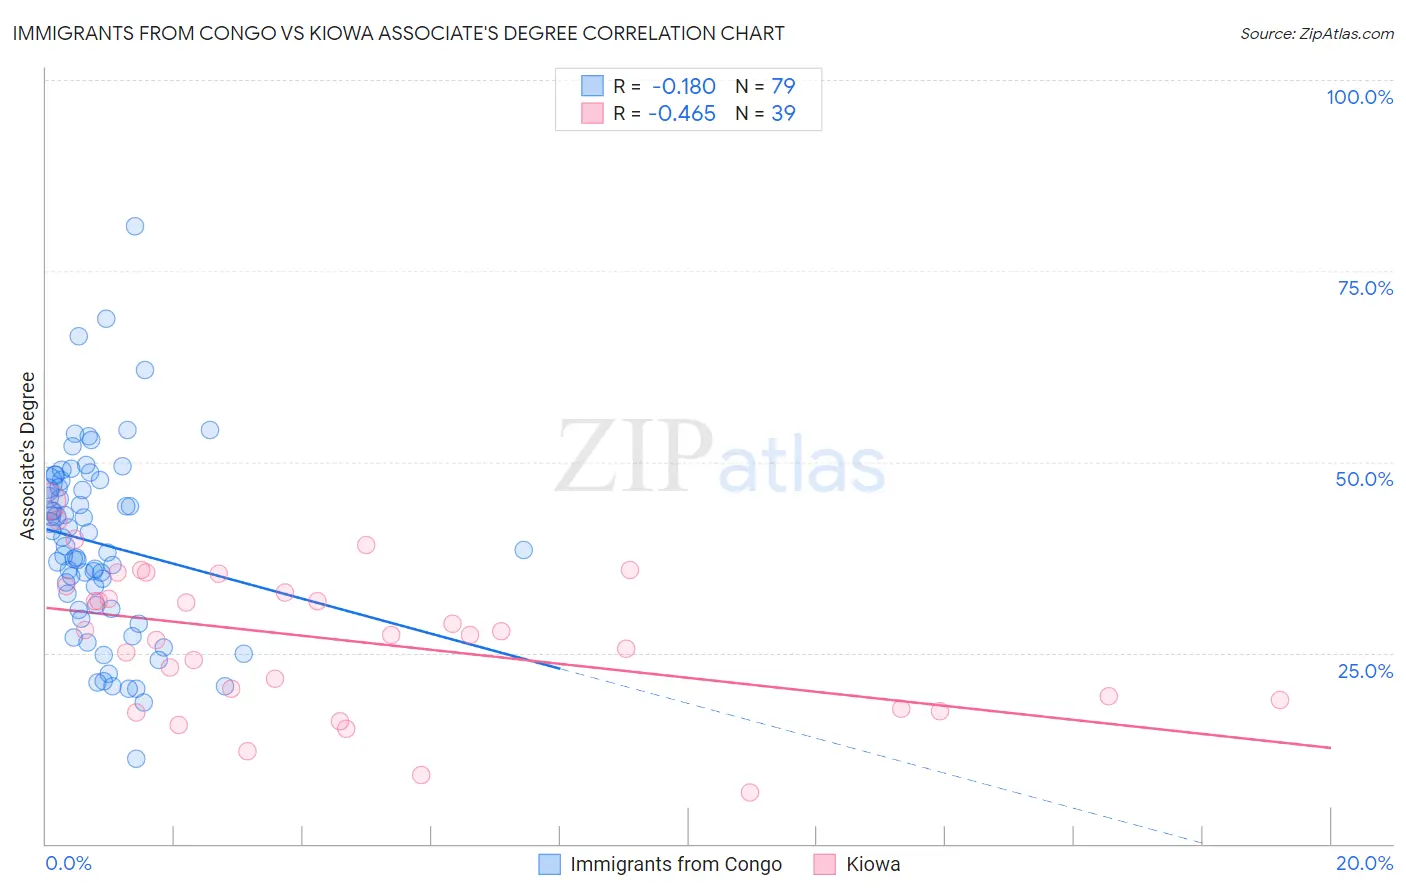
Immigrants from Congo vs Kiowa Associate's Degree Correlation Chart
The statistical analysis conducted on geographies consisting of 92,128,730 people shows a poor negative correlation between the proportion of Immigrants from Congo and percentage of population with at least associate's degree education in the United States with a correlation coefficient (R) of -0.180 and weighted average of 41.8%. Similarly, the statistical analysis conducted on geographies consisting of 56,101,363 people shows a moderate negative correlation between the proportion of Kiowa and percentage of population with at least associate's degree education in the United States with a correlation coefficient (R) of -0.465 and weighted average of 36.5%, a difference of 14.6%.
Associate's Degree Correlation Summary
| Measurement | Immigrants from Congo | Kiowa |
| Minimum | 11.1% | 6.8% |
| Maximum | 80.9% | 44.8% |
| Range | 69.7% | 38.0% |
| Mean | 39.3% | 26.7% |
| Median | 39.0% | 27.3% |
| Interquartile 25% (IQ1) | 30.7% | 18.7% |
| Interquartile 75% (IQ3) | 47.3% | 33.7% |
| Interquartile Range (IQR) | 16.6% | 15.0% |
| Standard Deviation (Sample) | 12.3% | 9.3% |
| Standard Deviation (Population) | 12.2% | 9.2% |
Similar Demographics by Associate's Degree
Demographics Similar to Immigrants from Congo by Associate's Degree
In terms of associate's degree, the demographic groups most similar to Immigrants from Congo are Spanish American (41.8%, a difference of 0.060%), Immigrants from Guyana (41.8%, a difference of 0.12%), Cuban (41.9%, a difference of 0.21%), Japanese (41.7%, a difference of 0.27%), and Indonesian (41.9%, a difference of 0.28%).
| Demographics | Rating | Rank | Associate's Degree |
| Jamaicans | 0.7 /100 | #249 | Tragic 42.1% |
| U.S. Virgin Islanders | 0.7 /100 | #250 | Tragic 42.1% |
| Immigrants | Bahamas | 0.7 /100 | #251 | Tragic 42.1% |
| French American Indians | 0.6 /100 | #252 | Tragic 42.0% |
| Indonesians | 0.6 /100 | #253 | Tragic 41.9% |
| Cubans | 0.6 /100 | #254 | Tragic 41.9% |
| Immigrants | Guyana | 0.5 /100 | #255 | Tragic 41.8% |
| Immigrants | Congo | 0.5 /100 | #256 | Tragic 41.8% |
| Spanish Americans | 0.5 /100 | #257 | Tragic 41.8% |
| Japanese | 0.5 /100 | #258 | Tragic 41.7% |
| Malaysians | 0.4 /100 | #259 | Tragic 41.6% |
| Marshallese | 0.4 /100 | #260 | Tragic 41.6% |
| Nicaraguans | 0.4 /100 | #261 | Tragic 41.5% |
| Bahamians | 0.4 /100 | #262 | Tragic 41.5% |
| Immigrants | Jamaica | 0.3 /100 | #263 | Tragic 41.5% |
Demographics Similar to Kiowa by Associate's Degree
In terms of associate's degree, the demographic groups most similar to Kiowa are Dutch West Indian (36.5%, a difference of 0.020%), Alaskan Athabascan (36.5%, a difference of 0.030%), Paiute (36.4%, a difference of 0.32%), Menominee (36.7%, a difference of 0.56%), and Apache (36.2%, a difference of 0.63%).
| Demographics | Rating | Rank | Associate's Degree |
| Fijians | 0.0 /100 | #319 | Tragic 37.4% |
| Cajuns | 0.0 /100 | #320 | Tragic 37.4% |
| Immigrants | Yemen | 0.0 /100 | #321 | Tragic 37.3% |
| Pennsylvania Germans | 0.0 /100 | #322 | Tragic 37.2% |
| Immigrants | Cabo Verde | 0.0 /100 | #323 | Tragic 36.8% |
| Arapaho | 0.0 /100 | #324 | Tragic 36.7% |
| Menominee | 0.0 /100 | #325 | Tragic 36.7% |
| Kiowa | 0.0 /100 | #326 | Tragic 36.5% |
| Dutch West Indians | 0.0 /100 | #327 | Tragic 36.5% |
| Alaskan Athabascans | 0.0 /100 | #328 | Tragic 36.5% |
| Paiute | 0.0 /100 | #329 | Tragic 36.4% |
| Apache | 0.0 /100 | #330 | Tragic 36.2% |
| Immigrants | Azores | 0.0 /100 | #331 | Tragic 35.6% |
| Immigrants | Central America | 0.0 /100 | #332 | Tragic 35.0% |
| Mexicans | 0.0 /100 | #333 | Tragic 35.0% |