Immigrants from Congo vs Austrian Associate's Degree
COMPARE
Immigrants from Congo
Austrian
Associate's Degree
Associate's Degree Comparison
Immigrants from Congo
Austrians
41.8%
ASSOCIATE'S DEGREE
0.5/ 100
METRIC RATING
256th/ 347
METRIC RANK
49.1%
ASSOCIATE'S DEGREE
95.8/ 100
METRIC RATING
110th/ 347
METRIC RANK
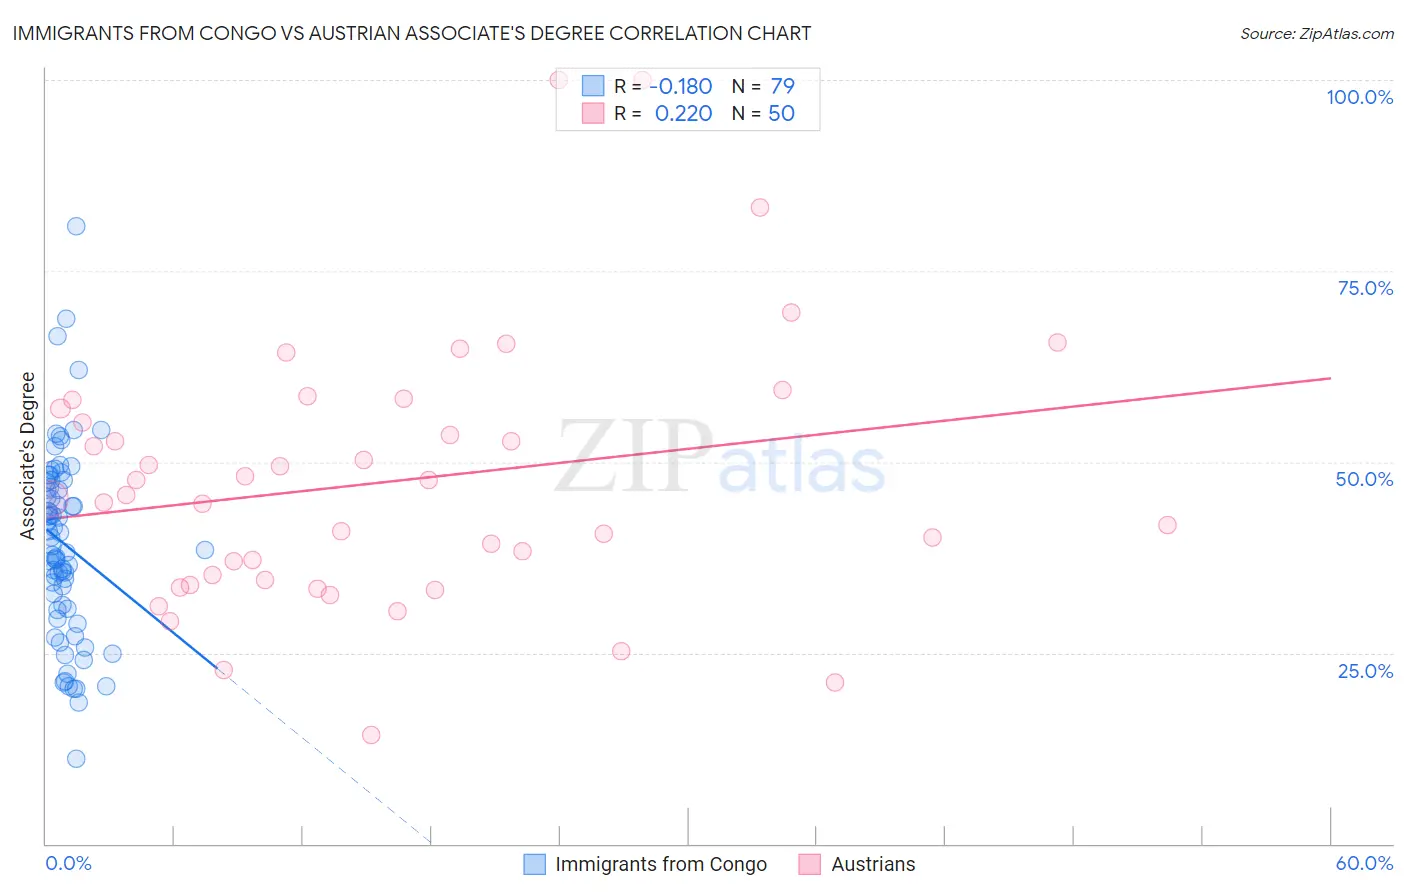
Immigrants from Congo vs Austrian Associate's Degree Correlation Chart
The statistical analysis conducted on geographies consisting of 92,128,730 people shows a poor negative correlation between the proportion of Immigrants from Congo and percentage of population with at least associate's degree education in the United States with a correlation coefficient (R) of -0.180 and weighted average of 41.8%. Similarly, the statistical analysis conducted on geographies consisting of 452,054,791 people shows a weak positive correlation between the proportion of Austrians and percentage of population with at least associate's degree education in the United States with a correlation coefficient (R) of 0.220 and weighted average of 49.1%, a difference of 17.4%.
Associate's Degree Correlation Summary
| Measurement | Immigrants from Congo | Austrian |
| Minimum | 11.1% | 14.3% |
| Maximum | 80.9% | 100.0% |
| Range | 69.7% | 85.7% |
| Mean | 39.3% | 47.4% |
| Median | 39.0% | 45.5% |
| Interquartile 25% (IQ1) | 30.7% | 34.5% |
| Interquartile 75% (IQ3) | 47.3% | 57.0% |
| Interquartile Range (IQR) | 16.6% | 22.5% |
| Standard Deviation (Sample) | 12.3% | 17.5% |
| Standard Deviation (Population) | 12.2% | 17.3% |
Similar Demographics by Associate's Degree
Demographics Similar to Immigrants from Congo by Associate's Degree
In terms of associate's degree, the demographic groups most similar to Immigrants from Congo are Spanish American (41.8%, a difference of 0.060%), Immigrants from Guyana (41.8%, a difference of 0.12%), Cuban (41.9%, a difference of 0.21%), Japanese (41.7%, a difference of 0.27%), and Indonesian (41.9%, a difference of 0.28%).
| Demographics | Rating | Rank | Associate's Degree |
| Jamaicans | 0.7 /100 | #249 | Tragic 42.1% |
| U.S. Virgin Islanders | 0.7 /100 | #250 | Tragic 42.1% |
| Immigrants | Bahamas | 0.7 /100 | #251 | Tragic 42.1% |
| French American Indians | 0.6 /100 | #252 | Tragic 42.0% |
| Indonesians | 0.6 /100 | #253 | Tragic 41.9% |
| Cubans | 0.6 /100 | #254 | Tragic 41.9% |
| Immigrants | Guyana | 0.5 /100 | #255 | Tragic 41.8% |
| Immigrants | Congo | 0.5 /100 | #256 | Tragic 41.8% |
| Spanish Americans | 0.5 /100 | #257 | Tragic 41.8% |
| Japanese | 0.5 /100 | #258 | Tragic 41.7% |
| Malaysians | 0.4 /100 | #259 | Tragic 41.6% |
| Marshallese | 0.4 /100 | #260 | Tragic 41.6% |
| Nicaraguans | 0.4 /100 | #261 | Tragic 41.5% |
| Bahamians | 0.4 /100 | #262 | Tragic 41.5% |
| Immigrants | Jamaica | 0.3 /100 | #263 | Tragic 41.5% |
Demographics Similar to Austrians by Associate's Degree
In terms of associate's degree, the demographic groups most similar to Austrians are Immigrants from Venezuela (49.1%, a difference of 0.030%), Immigrants from Morocco (49.2%, a difference of 0.22%), Immigrants from Chile (49.0%, a difference of 0.22%), Palestinian (49.0%, a difference of 0.22%), and Arab (49.0%, a difference of 0.22%).
| Demographics | Rating | Rank | Associate's Degree |
| Ukrainians | 97.1 /100 | #103 | Exceptional 49.4% |
| Venezuelans | 97.0 /100 | #104 | Exceptional 49.4% |
| Croatians | 96.8 /100 | #105 | Exceptional 49.3% |
| Immigrants | Italy | 96.7 /100 | #106 | Exceptional 49.3% |
| Syrians | 96.7 /100 | #107 | Exceptional 49.3% |
| Jordanians | 96.6 /100 | #108 | Exceptional 49.2% |
| Immigrants | Morocco | 96.3 /100 | #109 | Exceptional 49.2% |
| Austrians | 95.8 /100 | #110 | Exceptional 49.1% |
| Immigrants | Venezuela | 95.8 /100 | #111 | Exceptional 49.1% |
| Immigrants | Chile | 95.3 /100 | #112 | Exceptional 49.0% |
| Palestinians | 95.3 /100 | #113 | Exceptional 49.0% |
| Arabs | 95.3 /100 | #114 | Exceptional 49.0% |
| Luxembourgers | 95.1 /100 | #115 | Exceptional 48.9% |
| British | 95.0 /100 | #116 | Exceptional 48.9% |
| Afghans | 94.8 /100 | #117 | Exceptional 48.9% |