Immigrants from Cambodia vs Arab Bachelor's Degree
COMPARE
Immigrants from Cambodia
Arab
Bachelor's Degree
Bachelor's Degree Comparison
Immigrants from Cambodia
Arabs
34.2%
BACHELOR'S DEGREE
1.9/ 100
METRIC RATING
241st/ 347
METRIC RANK
40.9%
BACHELOR'S DEGREE
96.6/ 100
METRIC RATING
109th/ 347
METRIC RANK
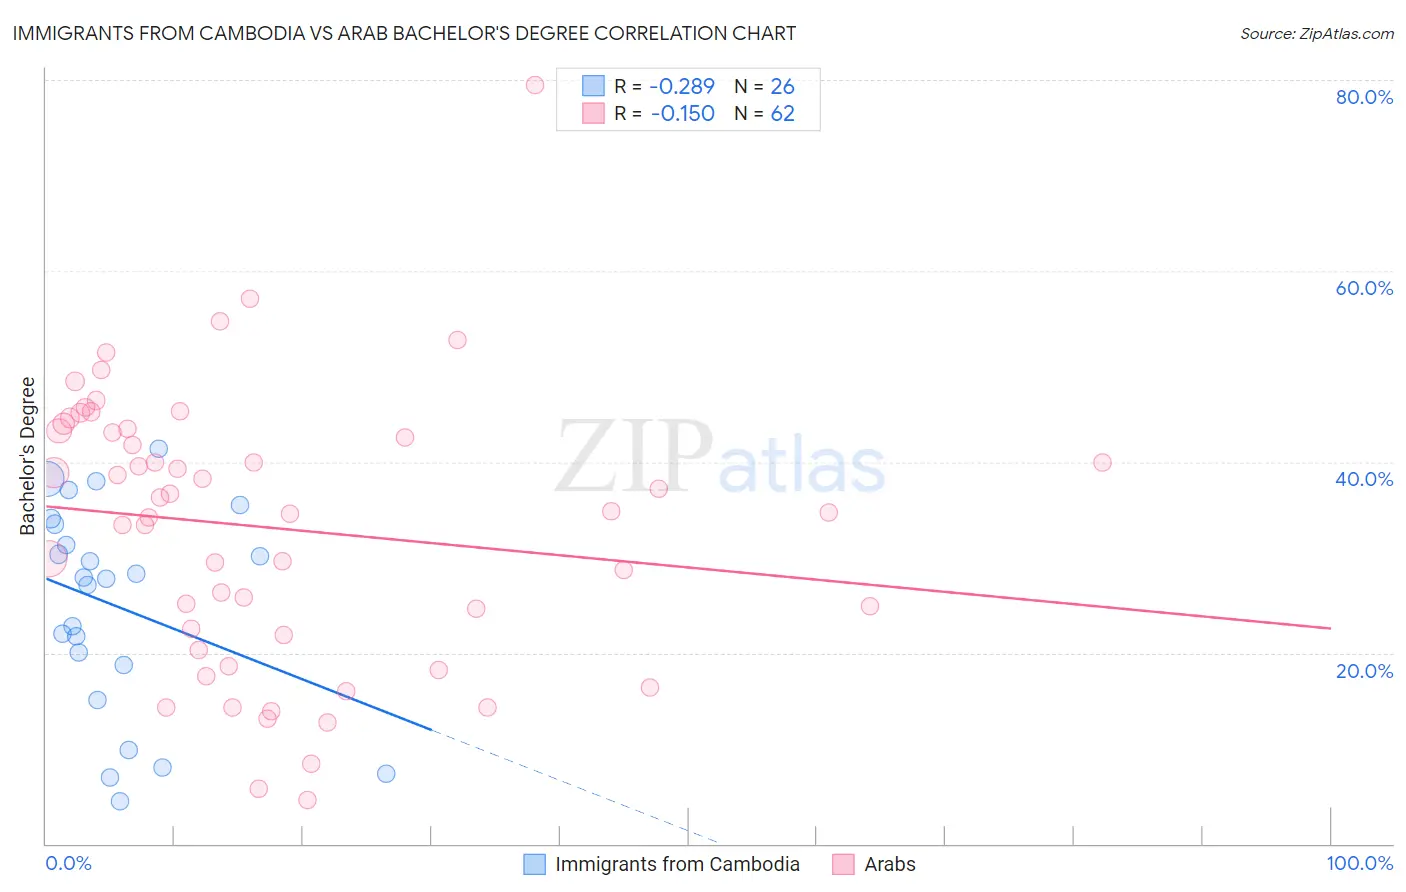
Immigrants from Cambodia vs Arab Bachelor's Degree Correlation Chart
The statistical analysis conducted on geographies consisting of 205,152,160 people shows a weak negative correlation between the proportion of Immigrants from Cambodia and percentage of population with at least bachelor's degree education in the United States with a correlation coefficient (R) of -0.289 and weighted average of 34.2%. Similarly, the statistical analysis conducted on geographies consisting of 486,810,717 people shows a poor negative correlation between the proportion of Arabs and percentage of population with at least bachelor's degree education in the United States with a correlation coefficient (R) of -0.150 and weighted average of 40.9%, a difference of 19.7%.
Bachelor's Degree Correlation Summary
| Measurement | Immigrants from Cambodia | Arab |
| Minimum | 4.5% | 4.6% |
| Maximum | 41.4% | 79.5% |
| Range | 36.9% | 74.9% |
| Mean | 24.9% | 33.1% |
| Median | 27.9% | 34.8% |
| Interquartile 25% (IQ1) | 18.8% | 21.9% |
| Interquartile 75% (IQ3) | 33.5% | 43.2% |
| Interquartile Range (IQR) | 14.7% | 21.4% |
| Standard Deviation (Sample) | 10.8% | 14.4% |
| Standard Deviation (Population) | 10.6% | 14.3% |
Similar Demographics by Bachelor's Degree
Demographics Similar to Immigrants from Cambodia by Bachelor's Degree
In terms of bachelor's degree, the demographic groups most similar to Immigrants from Cambodia are Nonimmigrants (34.2%, a difference of 0.060%), Tongan (34.3%, a difference of 0.26%), Immigrants from Guyana (33.9%, a difference of 0.71%), British West Indian (34.5%, a difference of 0.80%), and Guyanese (34.5%, a difference of 0.82%).
| Demographics | Rating | Rank | Bachelor's Degree |
| Guamanians/Chamorros | 3.0 /100 | #234 | Tragic 34.6% |
| Immigrants | West Indies | 2.9 /100 | #235 | Tragic 34.6% |
| Liberians | 2.8 /100 | #236 | Tragic 34.6% |
| Tlingit-Haida | 2.8 /100 | #237 | Tragic 34.6% |
| Guyanese | 2.5 /100 | #238 | Tragic 34.5% |
| British West Indians | 2.5 /100 | #239 | Tragic 34.5% |
| Tongans | 2.0 /100 | #240 | Tragic 34.3% |
| Immigrants | Cambodia | 1.9 /100 | #241 | Tragic 34.2% |
| Immigrants | Nonimmigrants | 1.8 /100 | #242 | Tragic 34.2% |
| Immigrants | Guyana | 1.4 /100 | #243 | Tragic 33.9% |
| Delaware | 1.2 /100 | #244 | Tragic 33.8% |
| Immigrants | Fiji | 1.2 /100 | #245 | Tragic 33.7% |
| Jamaicans | 1.0 /100 | #246 | Tragic 33.6% |
| Immigrants | Congo | 1.0 /100 | #247 | Tragic 33.6% |
| Cree | 1.0 /100 | #248 | Tragic 33.6% |
Demographics Similar to Arabs by Bachelor's Degree
In terms of bachelor's degree, the demographic groups most similar to Arabs are Ukrainian (40.9%, a difference of 0.020%), Albanian (40.9%, a difference of 0.080%), Immigrants from Chile (40.8%, a difference of 0.12%), Northern European (41.0%, a difference of 0.16%), and Ugandan (40.8%, a difference of 0.17%).
| Demographics | Rating | Rank | Bachelor's Degree |
| Immigrants | Italy | 97.8 /100 | #102 | Exceptional 41.3% |
| Chileans | 97.5 /100 | #103 | Exceptional 41.2% |
| Jordanians | 97.4 /100 | #104 | Exceptional 41.2% |
| Syrians | 97.4 /100 | #105 | Exceptional 41.1% |
| Alsatians | 97.0 /100 | #106 | Exceptional 41.0% |
| Northern Europeans | 96.8 /100 | #107 | Exceptional 41.0% |
| Ukrainians | 96.6 /100 | #108 | Exceptional 40.9% |
| Arabs | 96.6 /100 | #109 | Exceptional 40.9% |
| Albanians | 96.5 /100 | #110 | Exceptional 40.9% |
| Immigrants | Chile | 96.4 /100 | #111 | Exceptional 40.8% |
| Ugandans | 96.3 /100 | #112 | Exceptional 40.8% |
| Brazilians | 96.3 /100 | #113 | Exceptional 40.8% |
| Afghans | 96.2 /100 | #114 | Exceptional 40.8% |
| Palestinians | 95.8 /100 | #115 | Exceptional 40.7% |
| Immigrants | Uganda | 95.7 /100 | #116 | Exceptional 40.7% |