Immigrants from Congo vs Arab In Labor Force | Age 25-29
COMPARE
Immigrants from Congo
Arab
In Labor Force | Age 25-29
In Labor Force | Age 25-29 Comparison
Immigrants from Congo
Arabs
84.2%
IN LABOR FORCE | AGE 25-29
5.8/ 100
METRIC RATING
226th/ 347
METRIC RANK
84.2%
IN LABOR FORCE | AGE 25-29
6.8/ 100
METRIC RATING
221st/ 347
METRIC RANK
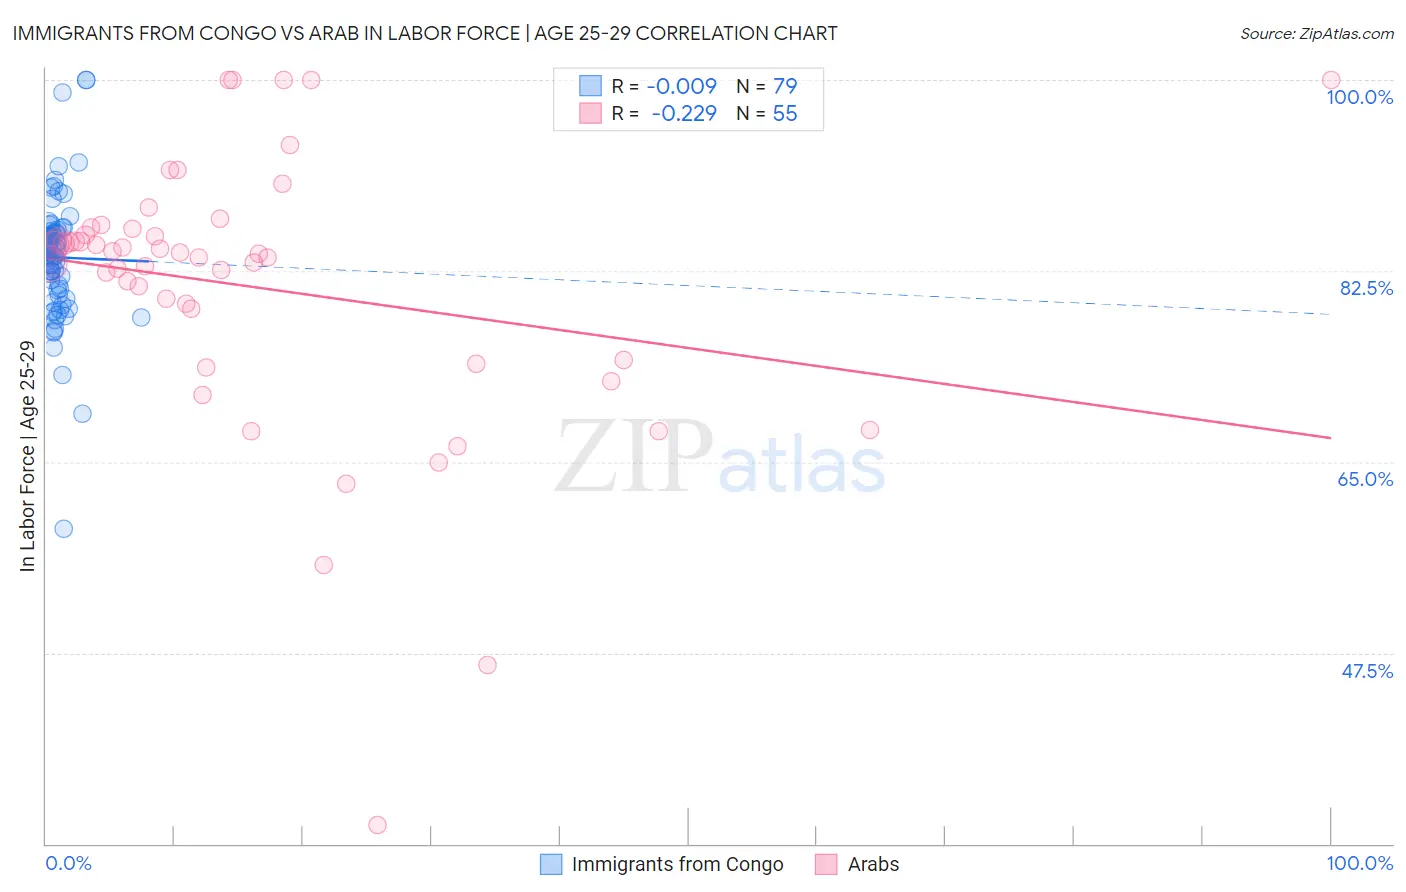
Immigrants from Congo vs Arab In Labor Force | Age 25-29 Correlation Chart
The statistical analysis conducted on geographies consisting of 92,133,427 people shows no correlation between the proportion of Immigrants from Congo and labor force participation rate among population between the ages 25 and 29 in the United States with a correlation coefficient (R) of -0.009 and weighted average of 84.2%. Similarly, the statistical analysis conducted on geographies consisting of 486,557,270 people shows a weak negative correlation between the proportion of Arabs and labor force participation rate among population between the ages 25 and 29 in the United States with a correlation coefficient (R) of -0.229 and weighted average of 84.2%, a difference of 0.030%.
In Labor Force | Age 25-29 Correlation Summary
| Measurement | Immigrants from Congo | Arab |
| Minimum | 58.9% | 31.7% |
| Maximum | 100.0% | 100.0% |
| Range | 41.1% | 68.3% |
| Mean | 83.7% | 81.0% |
| Median | 84.3% | 84.1% |
| Interquartile 25% (IQ1) | 80.7% | 74.3% |
| Interquartile 75% (IQ3) | 86.1% | 86.4% |
| Interquartile Range (IQR) | 5.3% | 12.1% |
| Standard Deviation (Sample) | 5.9% | 12.7% |
| Standard Deviation (Population) | 5.9% | 12.5% |
Demographics Similar to Immigrants from Congo and Arabs by In Labor Force | Age 25-29
In terms of in labor force | age 25-29, the demographic groups most similar to Immigrants from Congo are Korean (84.2%, a difference of 0.0%), Immigrants from West Indies (84.2%, a difference of 0.010%), French American Indian (84.2%, a difference of 0.010%), Immigrants from Panama (84.2%, a difference of 0.010%), and Scotch-Irish (84.2%, a difference of 0.020%). Similarly, the demographic groups most similar to Arabs are Jordanian (84.2%, a difference of 0.0%), Nigerian (84.3%, a difference of 0.010%), Scotch-Irish (84.2%, a difference of 0.010%), Immigrants from West Indies (84.2%, a difference of 0.020%), and Korean (84.2%, a difference of 0.030%).
| Demographics | Rating | Rank | In Labor Force | Age 25-29 |
| Japanese | 11.4 /100 | #213 | Poor 84.3% |
| Lebanese | 11.1 /100 | #214 | Poor 84.3% |
| Immigrants | Syria | 10.7 /100 | #215 | Poor 84.3% |
| Israelis | 9.3 /100 | #216 | Tragic 84.3% |
| Immigrants | Ecuador | 9.3 /100 | #217 | Tragic 84.3% |
| Immigrants | Nigeria | 9.0 /100 | #218 | Tragic 84.3% |
| Immigrants | Saudi Arabia | 8.8 /100 | #219 | Tragic 84.3% |
| Nigerians | 7.2 /100 | #220 | Tragic 84.3% |
| Arabs | 6.8 /100 | #221 | Tragic 84.2% |
| Jordanians | 6.7 /100 | #222 | Tragic 84.2% |
| Scotch-Irish | 6.5 /100 | #223 | Tragic 84.2% |
| Immigrants | West Indies | 6.0 /100 | #224 | Tragic 84.2% |
| Koreans | 5.9 /100 | #225 | Tragic 84.2% |
| Immigrants | Congo | 5.8 /100 | #226 | Tragic 84.2% |
| French American Indians | 5.5 /100 | #227 | Tragic 84.2% |
| Immigrants | Panama | 5.5 /100 | #228 | Tragic 84.2% |
| Immigrants | Oceania | 5.0 /100 | #229 | Tragic 84.2% |
| Whites/Caucasians | 4.8 /100 | #230 | Tragic 84.2% |
| Immigrants | Philippines | 4.7 /100 | #231 | Tragic 84.2% |
| Panamanians | 4.5 /100 | #232 | Tragic 84.2% |
| Immigrants | Western Asia | 2.7 /100 | #233 | Tragic 84.1% |