Immigrants from China vs Delaware College, Under 1 year
COMPARE
Immigrants from China
Delaware
College, Under 1 year
College, Under 1 year Comparison
Immigrants from China
Delaware
70.9%
COLLEGE, UNDER 1 YEAR
99.9/ 100
METRIC RATING
30th/ 347
METRIC RANK
62.1%
COLLEGE, UNDER 1 YEAR
0.9/ 100
METRIC RATING
245th/ 347
METRIC RANK
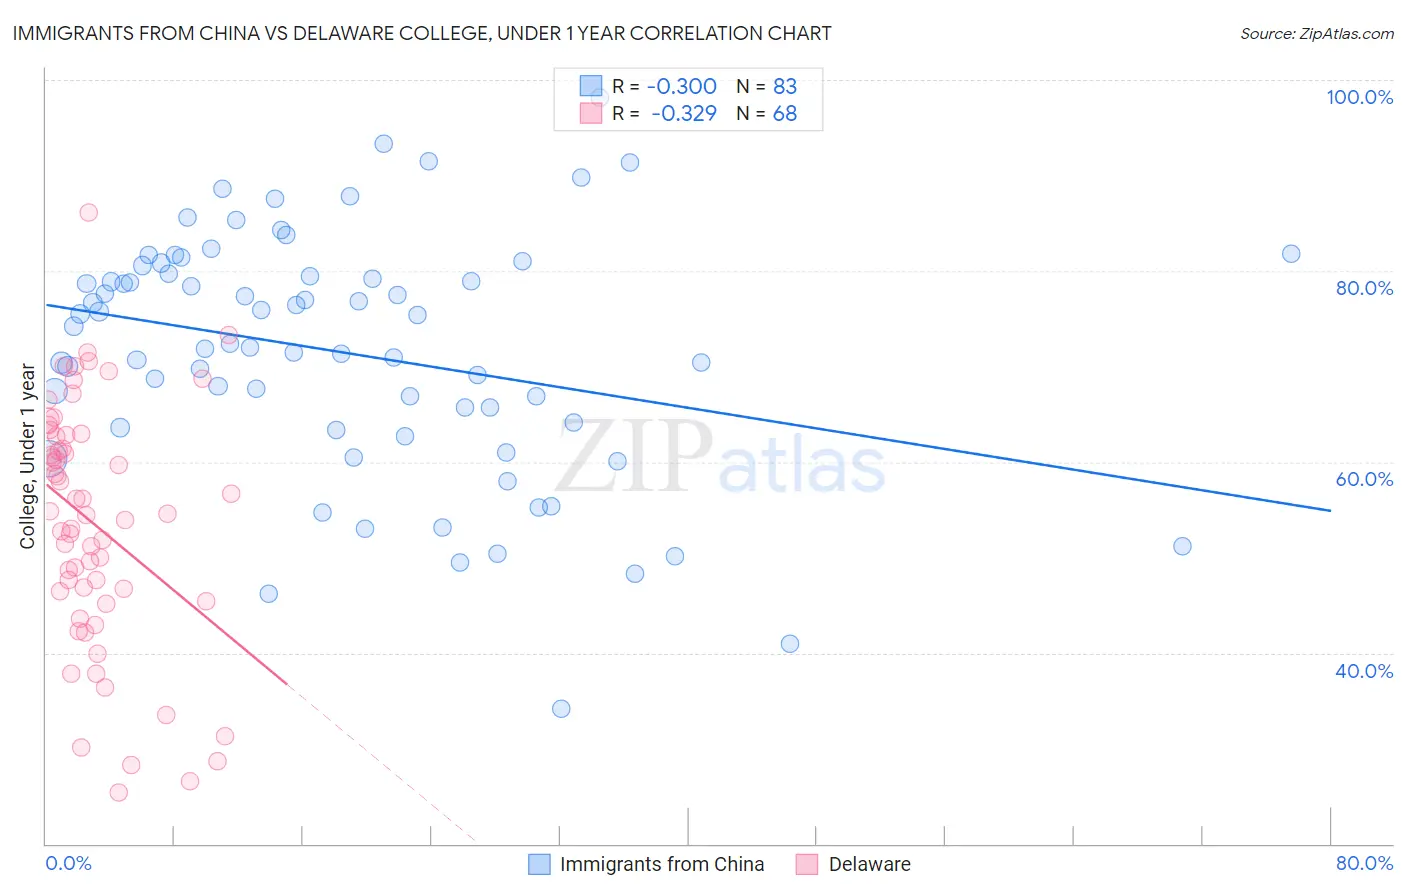
Immigrants from China vs Delaware College, Under 1 year Correlation Chart
The statistical analysis conducted on geographies consisting of 457,079,223 people shows a mild negative correlation between the proportion of Immigrants from China and percentage of population with at least college, under 1 year education in the United States with a correlation coefficient (R) of -0.300 and weighted average of 70.9%. Similarly, the statistical analysis conducted on geographies consisting of 96,235,398 people shows a mild negative correlation between the proportion of Delaware and percentage of population with at least college, under 1 year education in the United States with a correlation coefficient (R) of -0.329 and weighted average of 62.1%, a difference of 14.2%.
College, Under 1 year Correlation Summary
| Measurement | Immigrants from China | Delaware |
| Minimum | 34.2% | 25.3% |
| Maximum | 98.2% | 86.2% |
| Range | 64.0% | 60.9% |
| Mean | 71.4% | 53.5% |
| Median | 72.4% | 54.5% |
| Interquartile 25% (IQ1) | 63.6% | 45.9% |
| Interquartile 75% (IQ3) | 79.7% | 62.7% |
| Interquartile Range (IQR) | 16.1% | 16.8% |
| Standard Deviation (Sample) | 12.8% | 12.8% |
| Standard Deviation (Population) | 12.7% | 12.7% |
Similar Demographics by College, Under 1 year
Demographics Similar to Immigrants from China by College, Under 1 year
In terms of college, under 1 year, the demographic groups most similar to Immigrants from China are Indian (Asian) (70.8%, a difference of 0.11%), Immigrants from Hong Kong (71.0%, a difference of 0.18%), Immigrants from France (71.0%, a difference of 0.18%), Turkish (70.7%, a difference of 0.19%), and Immigrants from Ireland (71.0%, a difference of 0.21%).
| Demographics | Rating | Rank | College, Under 1 year |
| Immigrants | Northern Europe | 100.0 /100 | #23 | Exceptional 71.1% |
| Soviet Union | 100.0 /100 | #24 | Exceptional 71.1% |
| Bulgarians | 100.0 /100 | #25 | Exceptional 71.1% |
| Immigrants | Denmark | 100.0 /100 | #26 | Exceptional 71.0% |
| Immigrants | Ireland | 100.0 /100 | #27 | Exceptional 71.0% |
| Immigrants | Hong Kong | 100.0 /100 | #28 | Exceptional 71.0% |
| Immigrants | France | 100.0 /100 | #29 | Exceptional 71.0% |
| Immigrants | China | 99.9 /100 | #30 | Exceptional 70.9% |
| Indians (Asian) | 99.9 /100 | #31 | Exceptional 70.8% |
| Turks | 99.9 /100 | #32 | Exceptional 70.7% |
| Immigrants | South Africa | 99.9 /100 | #33 | Exceptional 70.6% |
| Estonians | 99.9 /100 | #34 | Exceptional 70.6% |
| Russians | 99.9 /100 | #35 | Exceptional 70.5% |
| Immigrants | Sri Lanka | 99.9 /100 | #36 | Exceptional 70.5% |
| Immigrants | Saudi Arabia | 99.9 /100 | #37 | Exceptional 70.4% |
Demographics Similar to Delaware by College, Under 1 year
In terms of college, under 1 year, the demographic groups most similar to Delaware are Colville (62.1%, a difference of 0.060%), Hawaiian (62.1%, a difference of 0.15%), Malaysian (62.2%, a difference of 0.18%), Marshallese (61.9%, a difference of 0.22%), and Ottawa (62.2%, a difference of 0.23%).
| Demographics | Rating | Rank | College, Under 1 year |
| French American Indians | 1.5 /100 | #238 | Tragic 62.4% |
| Nepalese | 1.1 /100 | #239 | Tragic 62.2% |
| Aleuts | 1.1 /100 | #240 | Tragic 62.2% |
| Ottawa | 1.1 /100 | #241 | Tragic 62.2% |
| Malaysians | 1.1 /100 | #242 | Tragic 62.2% |
| Hawaiians | 1.1 /100 | #243 | Tragic 62.1% |
| Colville | 1.0 /100 | #244 | Tragic 62.1% |
| Delaware | 0.9 /100 | #245 | Tragic 62.1% |
| Marshallese | 0.8 /100 | #246 | Tragic 61.9% |
| Immigrants | Liberia | 0.8 /100 | #247 | Tragic 61.9% |
| Potawatomi | 0.6 /100 | #248 | Tragic 61.8% |
| Vietnamese | 0.5 /100 | #249 | Tragic 61.7% |
| Immigrants | Congo | 0.5 /100 | #250 | Tragic 61.7% |
| Immigrants | Micronesia | 0.5 /100 | #251 | Tragic 61.5% |
| West Indians | 0.4 /100 | #252 | Tragic 61.5% |