Immigrants from China vs Immigrants from Portugal College, Under 1 year
COMPARE
Immigrants from China
Immigrants from Portugal
College, Under 1 year
College, Under 1 year Comparison
Immigrants from China
Immigrants from Portugal
70.9%
COLLEGE, UNDER 1 YEAR
99.9/ 100
METRIC RATING
30th/ 347
METRIC RANK
57.7%
COLLEGE, UNDER 1 YEAR
0.0/ 100
METRIC RATING
306th/ 347
METRIC RANK
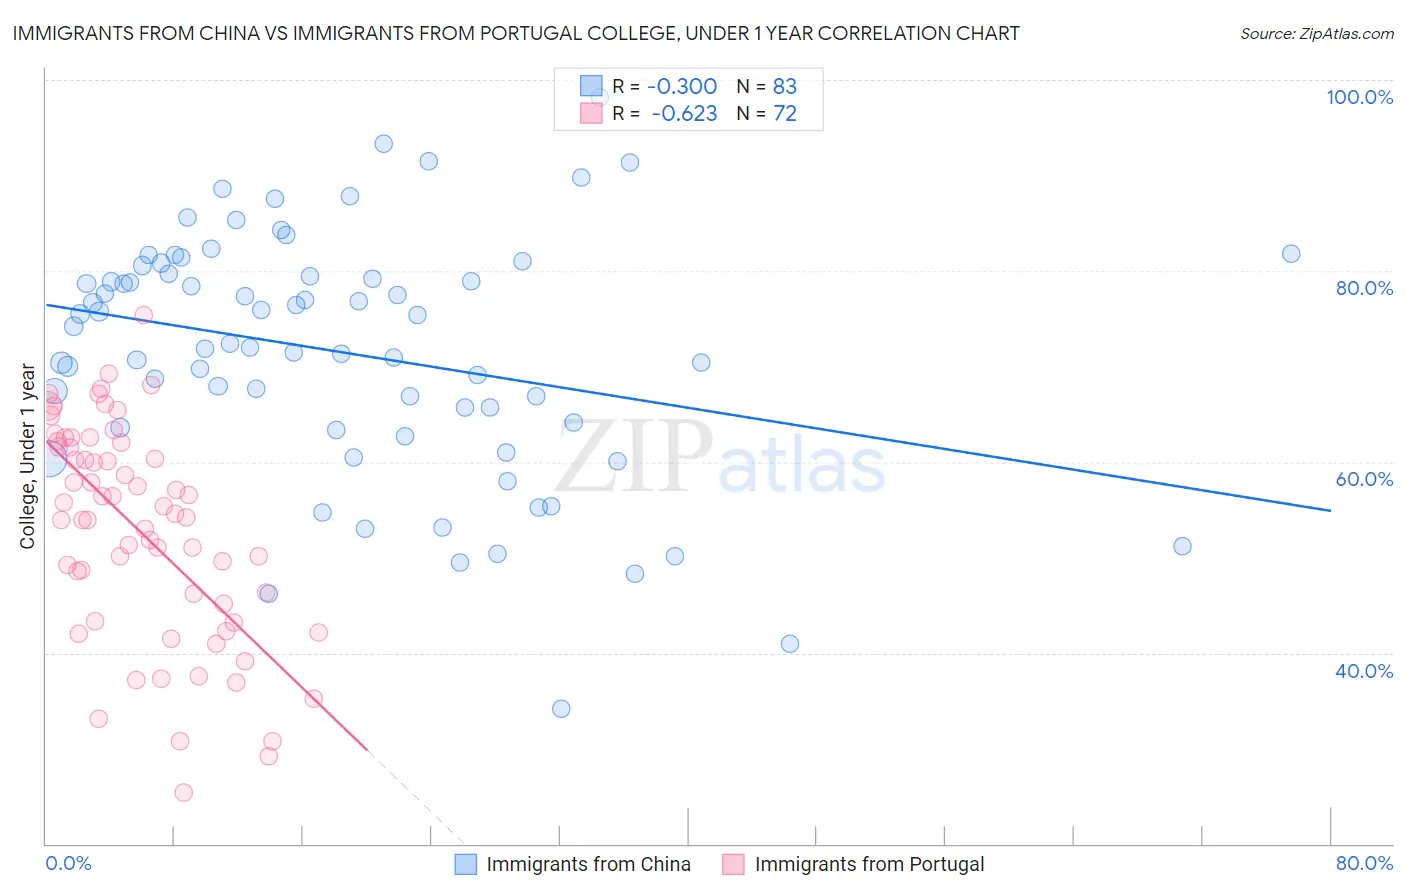
Immigrants from China vs Immigrants from Portugal College, Under 1 year Correlation Chart
The statistical analysis conducted on geographies consisting of 457,079,223 people shows a mild negative correlation between the proportion of Immigrants from China and percentage of population with at least college, under 1 year education in the United States with a correlation coefficient (R) of -0.300 and weighted average of 70.9%. Similarly, the statistical analysis conducted on geographies consisting of 174,792,047 people shows a significant negative correlation between the proportion of Immigrants from Portugal and percentage of population with at least college, under 1 year education in the United States with a correlation coefficient (R) of -0.623 and weighted average of 57.7%, a difference of 22.9%.
College, Under 1 year Correlation Summary
| Measurement | Immigrants from China | Immigrants from Portugal |
| Minimum | 34.2% | 25.4% |
| Maximum | 98.2% | 75.4% |
| Range | 64.0% | 50.1% |
| Mean | 71.4% | 52.8% |
| Median | 72.4% | 54.4% |
| Interquartile 25% (IQ1) | 63.6% | 44.2% |
| Interquartile 75% (IQ3) | 79.7% | 61.8% |
| Interquartile Range (IQR) | 16.1% | 17.6% |
| Standard Deviation (Sample) | 12.8% | 11.2% |
| Standard Deviation (Population) | 12.7% | 11.1% |
Similar Demographics by College, Under 1 year
Demographics Similar to Immigrants from China by College, Under 1 year
In terms of college, under 1 year, the demographic groups most similar to Immigrants from China are Indian (Asian) (70.8%, a difference of 0.11%), Immigrants from Hong Kong (71.0%, a difference of 0.18%), Immigrants from France (71.0%, a difference of 0.18%), Turkish (70.7%, a difference of 0.19%), and Immigrants from Ireland (71.0%, a difference of 0.21%).
| Demographics | Rating | Rank | College, Under 1 year |
| Immigrants | Northern Europe | 100.0 /100 | #23 | Exceptional 71.1% |
| Soviet Union | 100.0 /100 | #24 | Exceptional 71.1% |
| Bulgarians | 100.0 /100 | #25 | Exceptional 71.1% |
| Immigrants | Denmark | 100.0 /100 | #26 | Exceptional 71.0% |
| Immigrants | Ireland | 100.0 /100 | #27 | Exceptional 71.0% |
| Immigrants | Hong Kong | 100.0 /100 | #28 | Exceptional 71.0% |
| Immigrants | France | 100.0 /100 | #29 | Exceptional 71.0% |
| Immigrants | China | 99.9 /100 | #30 | Exceptional 70.9% |
| Indians (Asian) | 99.9 /100 | #31 | Exceptional 70.8% |
| Turks | 99.9 /100 | #32 | Exceptional 70.7% |
| Immigrants | South Africa | 99.9 /100 | #33 | Exceptional 70.6% |
| Estonians | 99.9 /100 | #34 | Exceptional 70.6% |
| Russians | 99.9 /100 | #35 | Exceptional 70.5% |
| Immigrants | Sri Lanka | 99.9 /100 | #36 | Exceptional 70.5% |
| Immigrants | Saudi Arabia | 99.9 /100 | #37 | Exceptional 70.4% |
Demographics Similar to Immigrants from Portugal by College, Under 1 year
In terms of college, under 1 year, the demographic groups most similar to Immigrants from Portugal are Fijian (57.7%, a difference of 0.010%), Central American (57.7%, a difference of 0.010%), Immigrants from Nicaragua (57.6%, a difference of 0.14%), Haitian (57.8%, a difference of 0.20%), and Kiowa (57.8%, a difference of 0.31%).
| Demographics | Rating | Rank | College, Under 1 year |
| Cubans | 0.0 /100 | #299 | Tragic 58.6% |
| Immigrants | Guyana | 0.0 /100 | #300 | Tragic 58.5% |
| Mexican American Indians | 0.0 /100 | #301 | Tragic 58.1% |
| Apache | 0.0 /100 | #302 | Tragic 58.0% |
| Immigrants | Dominica | 0.0 /100 | #303 | Tragic 57.9% |
| Kiowa | 0.0 /100 | #304 | Tragic 57.8% |
| Haitians | 0.0 /100 | #305 | Tragic 57.8% |
| Immigrants | Portugal | 0.0 /100 | #306 | Tragic 57.7% |
| Fijians | 0.0 /100 | #307 | Tragic 57.7% |
| Central Americans | 0.0 /100 | #308 | Tragic 57.7% |
| Immigrants | Nicaragua | 0.0 /100 | #309 | Tragic 57.6% |
| Pueblo | 0.0 /100 | #310 | Tragic 57.4% |
| Cajuns | 0.0 /100 | #311 | Tragic 57.3% |
| Salvadorans | 0.0 /100 | #312 | Tragic 57.3% |
| Dutch West Indians | 0.0 /100 | #313 | Tragic 57.2% |