Immigrants from Chile vs Immigrants from Trinidad and Tobago Single Mother Households
COMPARE
Immigrants from Chile
Immigrants from Trinidad and Tobago
Single Mother Households
Single Mother Households Comparison
Immigrants from Chile
Immigrants from Trinidad and Tobago
6.3%
SINGLE MOTHER HOUSEHOLDS
58.3/ 100
METRIC RATING
168th/ 347
METRIC RANK
7.6%
SINGLE MOTHER HOUSEHOLDS
0.1/ 100
METRIC RATING
277th/ 347
METRIC RANK
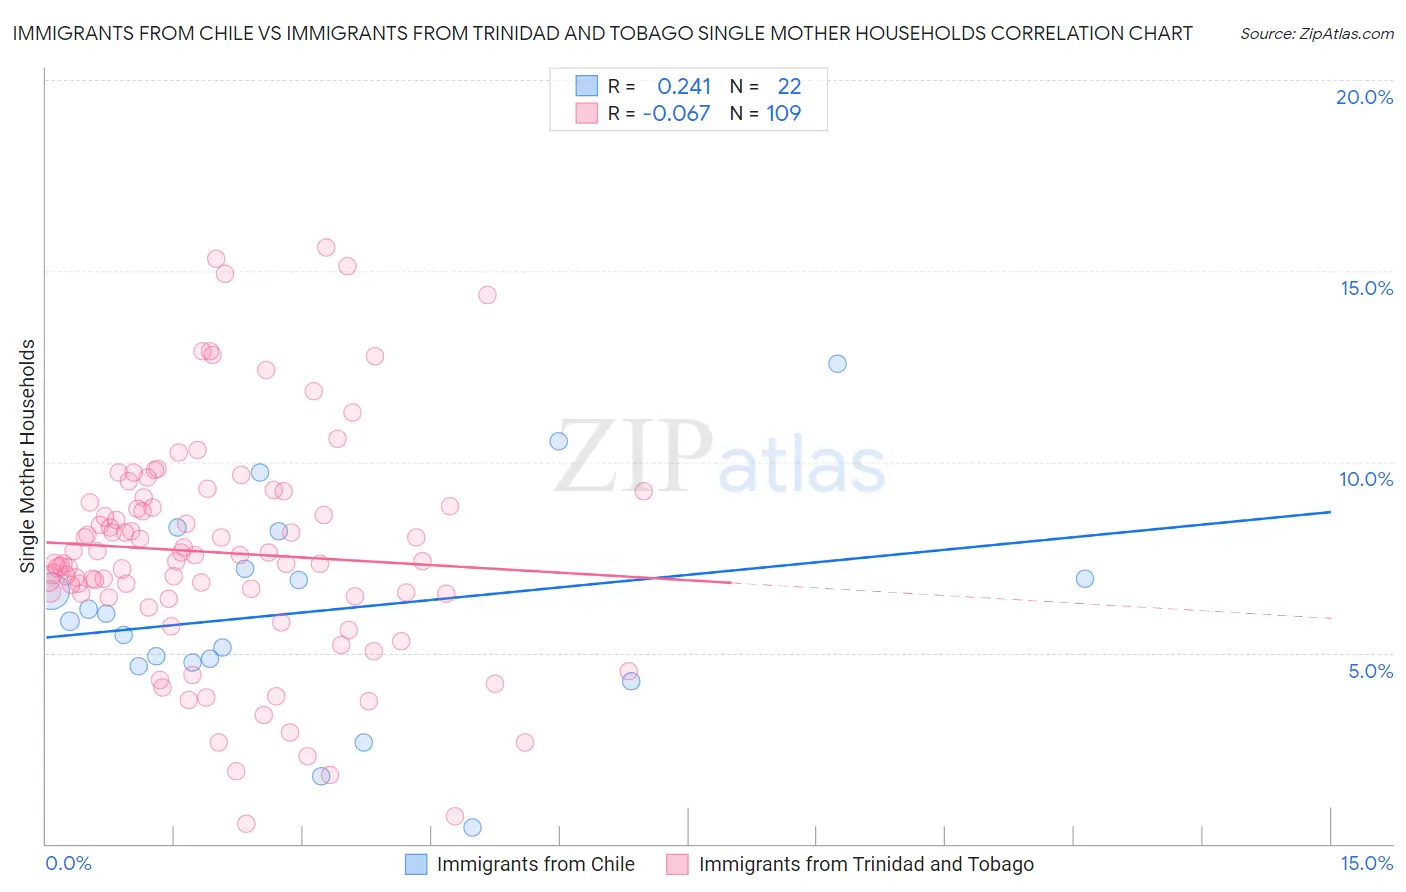
Immigrants from Chile vs Immigrants from Trinidad and Tobago Single Mother Households Correlation Chart
The statistical analysis conducted on geographies consisting of 218,462,093 people shows a weak positive correlation between the proportion of Immigrants from Chile and percentage of single mother households in the United States with a correlation coefficient (R) of 0.241 and weighted average of 6.3%. Similarly, the statistical analysis conducted on geographies consisting of 223,270,530 people shows a slight negative correlation between the proportion of Immigrants from Trinidad and Tobago and percentage of single mother households in the United States with a correlation coefficient (R) of -0.067 and weighted average of 7.6%, a difference of 21.6%.
Single Mother Households Correlation Summary
| Measurement | Immigrants from Chile | Immigrants from Trinidad and Tobago |
| Minimum | 0.42% | 0.52% |
| Maximum | 12.6% | 15.6% |
| Range | 12.2% | 15.1% |
| Mean | 6.1% | 7.6% |
| Median | 5.9% | 7.4% |
| Interquartile 25% (IQ1) | 4.7% | 6.5% |
| Interquartile 75% (IQ3) | 7.2% | 9.0% |
| Interquartile Range (IQR) | 2.5% | 2.5% |
| Standard Deviation (Sample) | 2.8% | 3.0% |
| Standard Deviation (Population) | 2.7% | 3.0% |
Similar Demographics by Single Mother Households
Demographics Similar to Immigrants from Chile by Single Mother Households
In terms of single mother households, the demographic groups most similar to Immigrants from Chile are Puget Sound Salish (6.3%, a difference of 0.020%), Brazilian (6.2%, a difference of 0.090%), Immigrants from Oceania (6.3%, a difference of 0.42%), Sri Lankan (6.2%, a difference of 0.65%), and Afghan (6.3%, a difference of 0.65%).
| Demographics | Rating | Rank | Single Mother Households |
| Immigrants | Germany | 72.4 /100 | #161 | Good 6.1% |
| Immigrants | Zimbabwe | 69.9 /100 | #162 | Good 6.2% |
| Alsatians | 68.7 /100 | #163 | Good 6.2% |
| Immigrants | Northern Africa | 68.0 /100 | #164 | Good 6.2% |
| Immigrants | Syria | 67.4 /100 | #165 | Good 6.2% |
| Sri Lankans | 63.9 /100 | #166 | Good 6.2% |
| Brazilians | 59.1 /100 | #167 | Average 6.2% |
| Immigrants | Chile | 58.3 /100 | #168 | Average 6.3% |
| Puget Sound Salish | 58.1 /100 | #169 | Average 6.3% |
| Immigrants | Oceania | 54.6 /100 | #170 | Average 6.3% |
| Afghans | 52.5 /100 | #171 | Average 6.3% |
| Immigrants | South Eastern Asia | 52.2 /100 | #172 | Average 6.3% |
| Immigrants | Vietnam | 51.5 /100 | #173 | Average 6.3% |
| Immigrants | Morocco | 50.0 /100 | #174 | Average 6.3% |
| Marshallese | 45.8 /100 | #175 | Average 6.3% |
Demographics Similar to Immigrants from Trinidad and Tobago by Single Mother Households
In terms of single mother households, the demographic groups most similar to Immigrants from Trinidad and Tobago are Central American (7.6%, a difference of 0.0%), Guyanese (7.6%, a difference of 0.040%), Immigrants from El Salvador (7.6%, a difference of 0.23%), Central American Indian (7.6%, a difference of 0.49%), and Immigrants from Guyana (7.6%, a difference of 0.59%).
| Demographics | Rating | Rank | Single Mother Households |
| Immigrants | Cuba | 0.1 /100 | #270 | Tragic 7.5% |
| Salvadorans | 0.1 /100 | #271 | Tragic 7.5% |
| Immigrants | Azores | 0.1 /100 | #272 | Tragic 7.5% |
| Belizeans | 0.1 /100 | #273 | Tragic 7.6% |
| Immigrants | Guyana | 0.1 /100 | #274 | Tragic 7.6% |
| Central American Indians | 0.1 /100 | #275 | Tragic 7.6% |
| Guyanese | 0.1 /100 | #276 | Tragic 7.6% |
| Immigrants | Trinidad and Tobago | 0.1 /100 | #277 | Tragic 7.6% |
| Central Americans | 0.1 /100 | #278 | Tragic 7.6% |
| Immigrants | El Salvador | 0.0 /100 | #279 | Tragic 7.6% |
| Immigrants | Sierra Leone | 0.0 /100 | #280 | Tragic 7.7% |
| Immigrants | Laos | 0.0 /100 | #281 | Tragic 7.7% |
| Guatemalans | 0.0 /100 | #282 | Tragic 7.7% |
| Nigerians | 0.0 /100 | #283 | Tragic 7.7% |
| Immigrants | Belize | 0.0 /100 | #284 | Tragic 7.7% |