Immigrants from Caribbean vs Immigrants from Cameroon Bachelor's Degree
COMPARE
Immigrants from Caribbean
Immigrants from Cameroon
Bachelor's Degree
Bachelor's Degree Comparison
Immigrants from Caribbean
Immigrants from Cameroon
31.4%
BACHELOR'S DEGREE
0.1/ 100
METRIC RATING
282nd/ 347
METRIC RANK
37.7%
BACHELOR'S DEGREE
46.8/ 100
METRIC RATING
178th/ 347
METRIC RANK
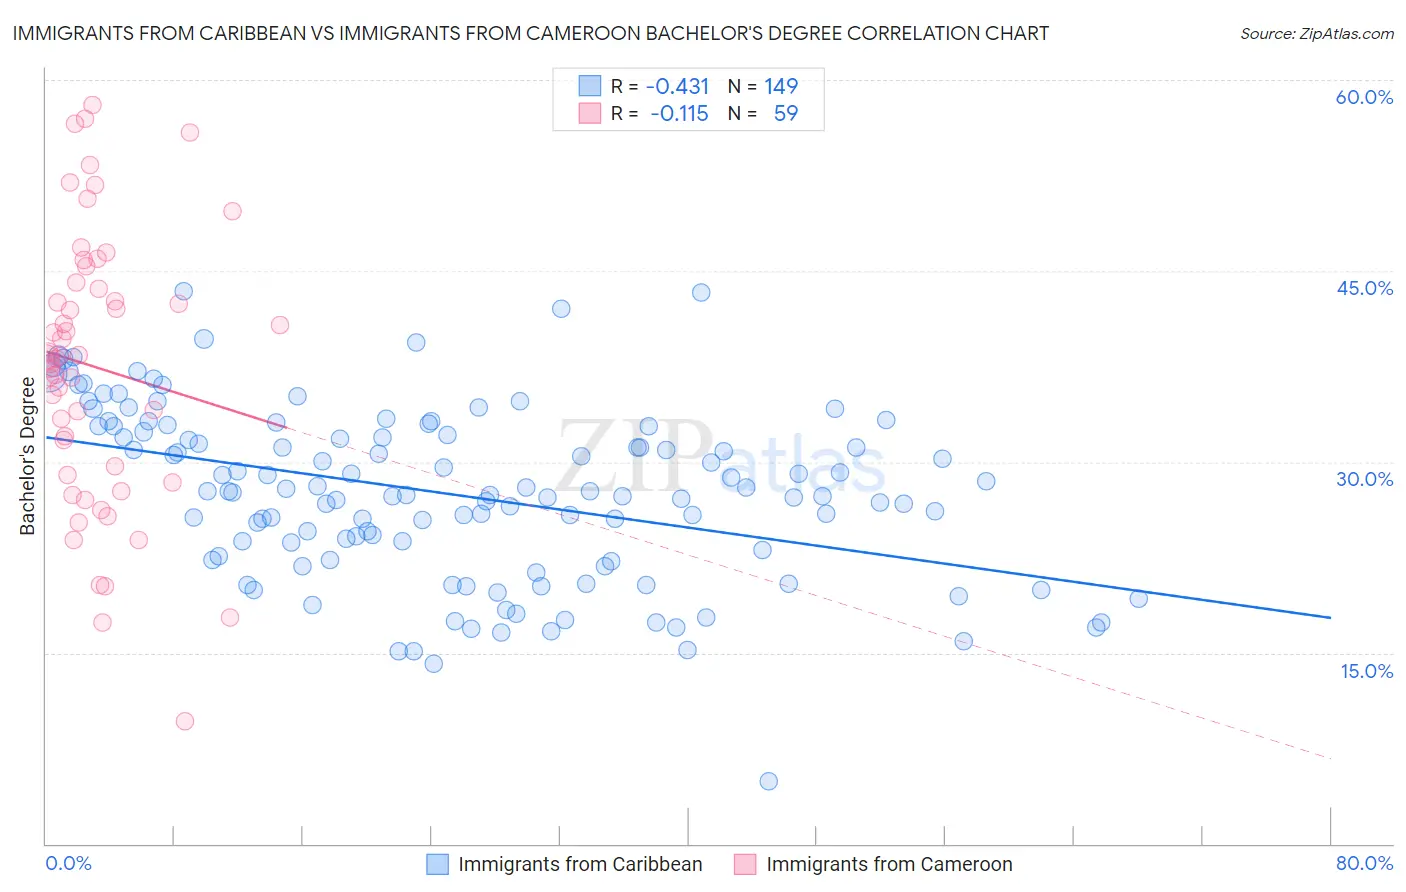
Immigrants from Caribbean vs Immigrants from Cameroon Bachelor's Degree Correlation Chart
The statistical analysis conducted on geographies consisting of 450,021,690 people shows a moderate negative correlation between the proportion of Immigrants from Caribbean and percentage of population with at least bachelor's degree education in the United States with a correlation coefficient (R) of -0.431 and weighted average of 31.4%. Similarly, the statistical analysis conducted on geographies consisting of 130,767,721 people shows a poor negative correlation between the proportion of Immigrants from Cameroon and percentage of population with at least bachelor's degree education in the United States with a correlation coefficient (R) of -0.115 and weighted average of 37.7%, a difference of 20.0%.
Bachelor's Degree Correlation Summary
| Measurement | Immigrants from Caribbean | Immigrants from Cameroon |
| Minimum | 4.9% | 9.6% |
| Maximum | 43.4% | 58.0% |
| Range | 38.5% | 48.4% |
| Mean | 27.5% | 37.4% |
| Median | 27.6% | 38.2% |
| Interquartile 25% (IQ1) | 22.5% | 28.9% |
| Interquartile 75% (IQ3) | 32.6% | 44.1% |
| Interquartile Range (IQR) | 10.1% | 15.1% |
| Standard Deviation (Sample) | 6.8% | 10.7% |
| Standard Deviation (Population) | 6.8% | 10.6% |
Similar Demographics by Bachelor's Degree
Demographics Similar to Immigrants from Caribbean by Bachelor's Degree
In terms of bachelor's degree, the demographic groups most similar to Immigrants from Caribbean are Blackfeet (31.5%, a difference of 0.15%), Honduran (31.3%, a difference of 0.28%), Haitian (31.3%, a difference of 0.31%), Aleut (31.3%, a difference of 0.32%), and Immigrants from El Salvador (31.3%, a difference of 0.38%).
| Demographics | Rating | Rank | Bachelor's Degree |
| Samoans | 0.1 /100 | #275 | Tragic 31.8% |
| Salvadorans | 0.1 /100 | #276 | Tragic 31.8% |
| Dominicans | 0.1 /100 | #277 | Tragic 31.8% |
| Marshallese | 0.1 /100 | #278 | Tragic 31.7% |
| Hawaiians | 0.1 /100 | #279 | Tragic 31.6% |
| Immigrants | Laos | 0.1 /100 | #280 | Tragic 31.6% |
| Blackfeet | 0.1 /100 | #281 | Tragic 31.5% |
| Immigrants | Caribbean | 0.1 /100 | #282 | Tragic 31.4% |
| Hondurans | 0.1 /100 | #283 | Tragic 31.3% |
| Haitians | 0.1 /100 | #284 | Tragic 31.3% |
| Aleuts | 0.1 /100 | #285 | Tragic 31.3% |
| Immigrants | El Salvador | 0.1 /100 | #286 | Tragic 31.3% |
| Ottawa | 0.1 /100 | #287 | Tragic 31.1% |
| Guatemalans | 0.1 /100 | #288 | Tragic 31.0% |
| Puerto Ricans | 0.1 /100 | #289 | Tragic 31.0% |
Demographics Similar to Immigrants from Cameroon by Bachelor's Degree
In terms of bachelor's degree, the demographic groups most similar to Immigrants from Cameroon are Basque (37.7%, a difference of 0.060%), Costa Rican (37.7%, a difference of 0.080%), Immigrants from Colombia (37.7%, a difference of 0.13%), Immigrants from Uruguay (37.8%, a difference of 0.15%), and Irish (37.6%, a difference of 0.24%).
| Demographics | Rating | Rank | Bachelor's Degree |
| Bermudans | 54.2 /100 | #171 | Average 38.0% |
| Immigrants | Somalia | 52.8 /100 | #172 | Average 37.9% |
| Immigrants | Iraq | 52.5 /100 | #173 | Average 37.9% |
| Immigrants | Bangladesh | 50.0 /100 | #174 | Average 37.8% |
| Immigrants | Uruguay | 48.3 /100 | #175 | Average 37.8% |
| Costa Ricans | 47.6 /100 | #176 | Average 37.7% |
| Basques | 47.4 /100 | #177 | Average 37.7% |
| Immigrants | Cameroon | 46.8 /100 | #178 | Average 37.7% |
| Immigrants | Colombia | 45.4 /100 | #179 | Average 37.7% |
| Irish | 44.3 /100 | #180 | Average 37.6% |
| Immigrants | Senegal | 43.8 /100 | #181 | Average 37.6% |
| Immigrants | Bosnia and Herzegovina | 43.4 /100 | #182 | Average 37.6% |
| Senegalese | 42.2 /100 | #183 | Average 37.5% |
| Scandinavians | 41.7 /100 | #184 | Average 37.5% |
| Immigrants | Peru | 41.3 /100 | #185 | Average 37.5% |