Spanish vs Chinese Bachelor's Degree
COMPARE
Spanish
Chinese
Bachelor's Degree
Bachelor's Degree Comparison
Spanish
Chinese
35.8%
BACHELOR'S DEGREE
9.6/ 100
METRIC RATING
220th/ 347
METRIC RANK
38.5%
BACHELOR'S DEGREE
66.6/ 100
METRIC RATING
159th/ 347
METRIC RANK
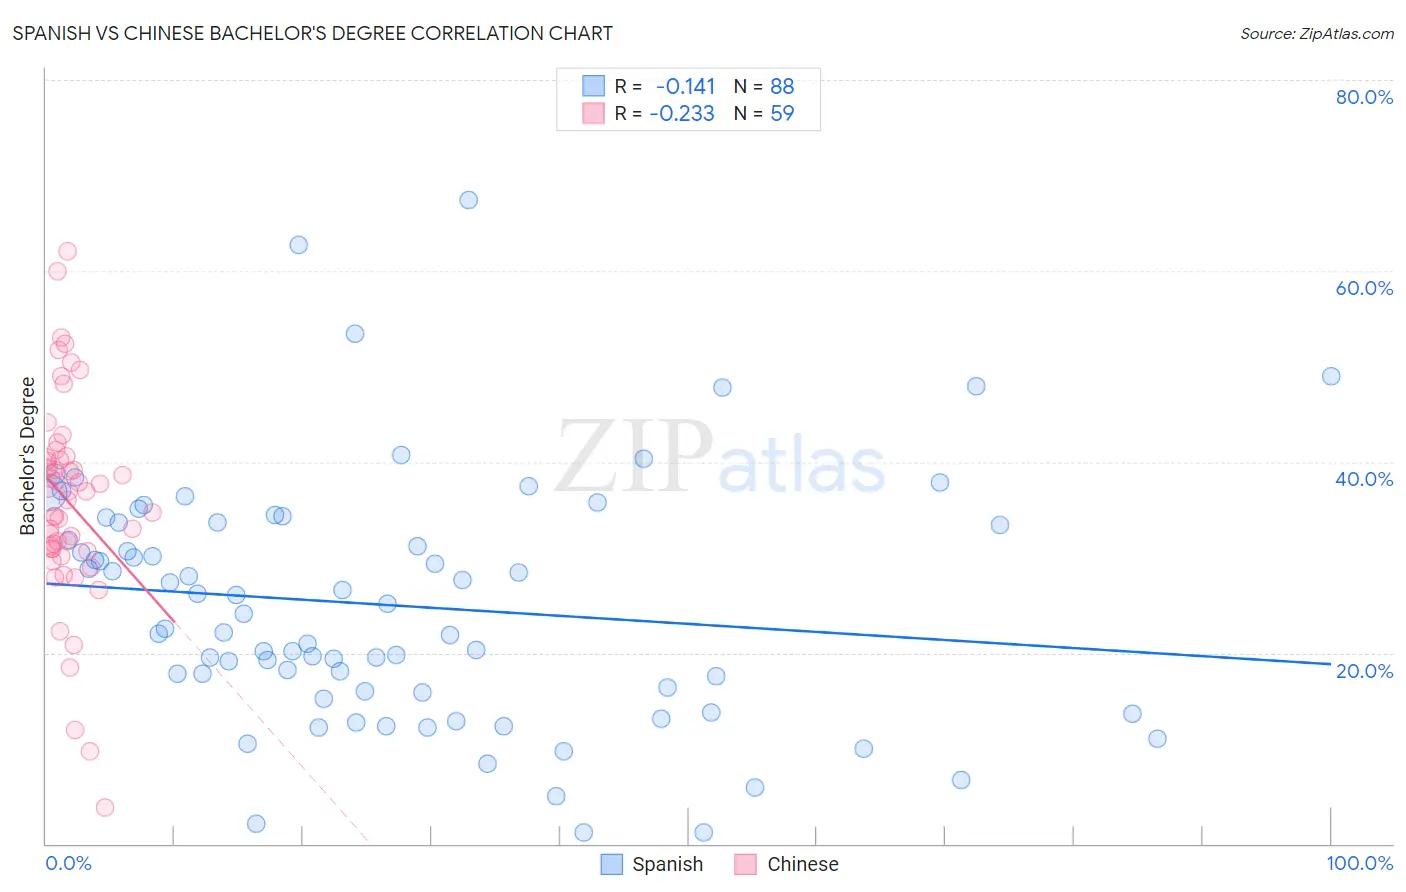
Spanish vs Chinese Bachelor's Degree Correlation Chart
The statistical analysis conducted on geographies consisting of 422,162,490 people shows a poor negative correlation between the proportion of Spanish and percentage of population with at least bachelor's degree education in the United States with a correlation coefficient (R) of -0.141 and weighted average of 35.8%. Similarly, the statistical analysis conducted on geographies consisting of 64,809,883 people shows a weak negative correlation between the proportion of Chinese and percentage of population with at least bachelor's degree education in the United States with a correlation coefficient (R) of -0.233 and weighted average of 38.5%, a difference of 7.5%.
Bachelor's Degree Correlation Summary
| Measurement | Spanish | Chinese |
| Minimum | 1.1% | 3.8% |
| Maximum | 67.4% | 62.0% |
| Range | 66.3% | 58.3% |
| Mean | 25.0% | 35.8% |
| Median | 23.3% | 36.9% |
| Interquartile 25% (IQ1) | 15.9% | 30.9% |
| Interquartile 75% (IQ3) | 33.6% | 40.3% |
| Interquartile Range (IQR) | 17.8% | 9.4% |
| Standard Deviation (Sample) | 12.9% | 10.8% |
| Standard Deviation (Population) | 12.9% | 10.7% |
Similar Demographics by Bachelor's Degree
Demographics Similar to Spanish by Bachelor's Degree
In terms of bachelor's degree, the demographic groups most similar to Spanish are West Indian (35.8%, a difference of 0.040%), Subsaharan African (35.8%, a difference of 0.070%), Dutch (35.7%, a difference of 0.11%), German Russian (35.8%, a difference of 0.17%), and Trinidadian and Tobagonian (35.7%, a difference of 0.25%).
| Demographics | Rating | Rank | Bachelor's Degree |
| Immigrants | Panama | 14.2 /100 | #213 | Poor 36.2% |
| Germans | 13.9 /100 | #214 | Poor 36.1% |
| Immigrants | Western Africa | 13.8 /100 | #215 | Poor 36.1% |
| Barbadians | 13.5 /100 | #216 | Poor 36.1% |
| German Russians | 10.2 /100 | #217 | Poor 35.8% |
| Sub-Saharan Africans | 9.8 /100 | #218 | Tragic 35.8% |
| West Indians | 9.7 /100 | #219 | Tragic 35.8% |
| Spanish | 9.6 /100 | #220 | Tragic 35.8% |
| Dutch | 9.2 /100 | #221 | Tragic 35.7% |
| Trinidadians and Tobagonians | 8.8 /100 | #222 | Tragic 35.7% |
| French Canadians | 8.3 /100 | #223 | Tragic 35.6% |
| Immigrants | Barbados | 7.5 /100 | #224 | Tragic 35.5% |
| Immigrants | Burma/Myanmar | 7.3 /100 | #225 | Tragic 35.5% |
| Portuguese | 7.2 /100 | #226 | Tragic 35.5% |
| Ecuadorians | 6.6 /100 | #227 | Tragic 35.4% |
Demographics Similar to Chinese by Bachelor's Degree
In terms of bachelor's degree, the demographic groups most similar to Chinese are Vietnamese (38.5%, a difference of 0.0%), Uruguayan (38.4%, a difference of 0.090%), Colombian (38.4%, a difference of 0.17%), Immigrants from Germany (38.6%, a difference of 0.33%), and Peruvian (38.3%, a difference of 0.34%).
| Demographics | Rating | Rank | Bachelor's Degree |
| Sudanese | 76.4 /100 | #152 | Good 38.9% |
| Slavs | 75.9 /100 | #153 | Good 38.9% |
| Canadians | 75.0 /100 | #154 | Good 38.8% |
| Immigrants | Kenya | 73.8 /100 | #155 | Good 38.8% |
| Kenyans | 72.5 /100 | #156 | Good 38.7% |
| Immigrants | South America | 70.1 /100 | #157 | Good 38.6% |
| Immigrants | Germany | 69.6 /100 | #158 | Good 38.6% |
| Chinese | 66.6 /100 | #159 | Good 38.5% |
| Vietnamese | 66.6 /100 | #160 | Good 38.5% |
| Uruguayans | 65.8 /100 | #161 | Good 38.4% |
| Colombians | 65.0 /100 | #162 | Good 38.4% |
| Peruvians | 63.4 /100 | #163 | Good 38.3% |
| Hungarians | 62.1 /100 | #164 | Good 38.3% |
| Sri Lankans | 59.1 /100 | #165 | Average 38.2% |
| Somalis | 58.6 /100 | #166 | Average 38.1% |