Immigrants from Eastern Asia vs Chinese Bachelor's Degree
COMPARE
Immigrants from Eastern Asia
Chinese
Bachelor's Degree
Bachelor's Degree Comparison
Immigrants from Eastern Asia
Chinese
48.1%
BACHELOR'S DEGREE
100.0/ 100
METRIC RATING
15th/ 347
METRIC RANK
38.5%
BACHELOR'S DEGREE
66.6/ 100
METRIC RATING
159th/ 347
METRIC RANK
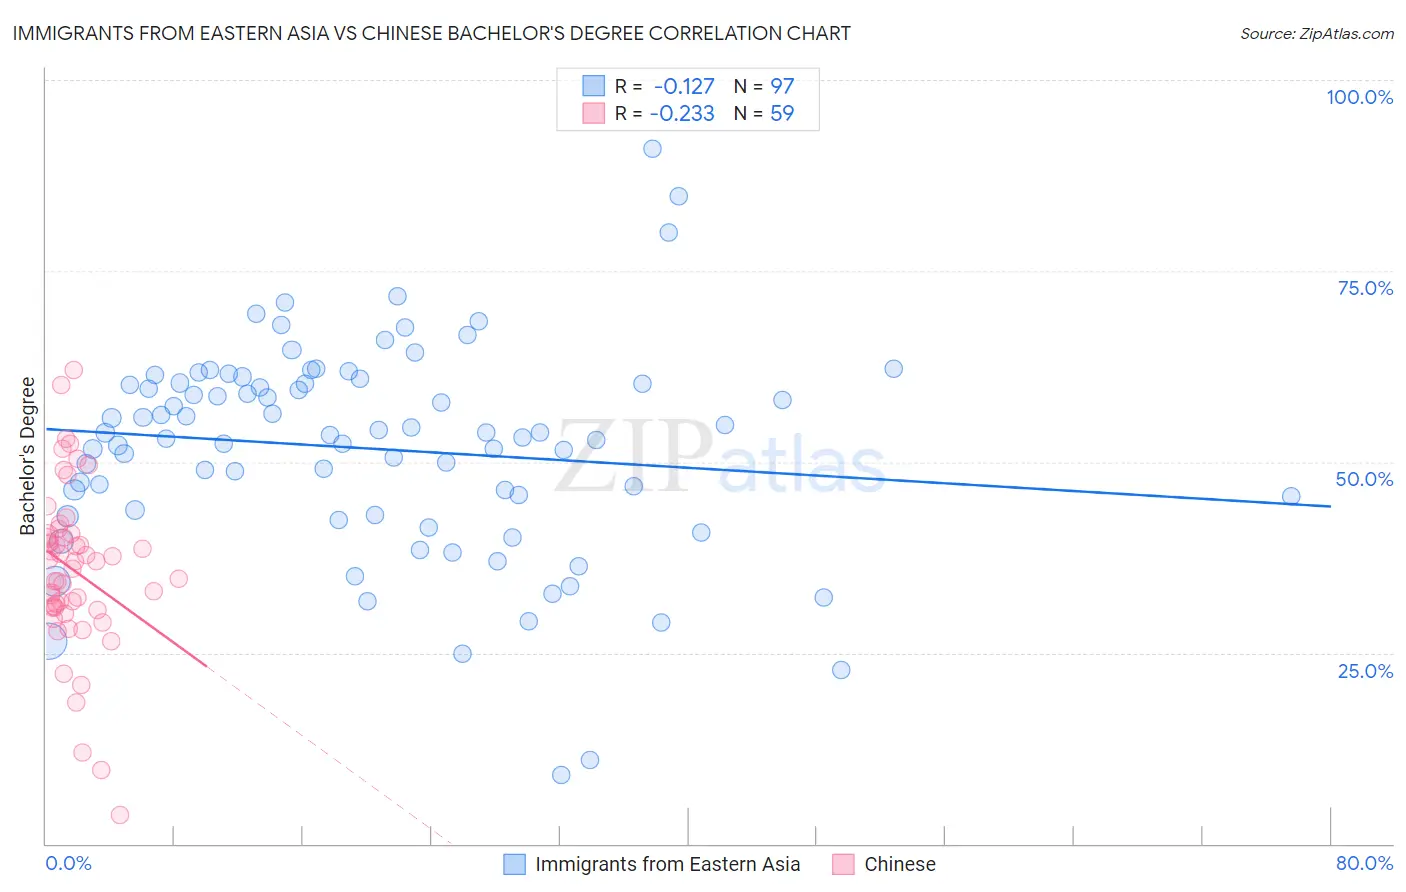
Immigrants from Eastern Asia vs Chinese Bachelor's Degree Correlation Chart
The statistical analysis conducted on geographies consisting of 499,849,194 people shows a poor negative correlation between the proportion of Immigrants from Eastern Asia and percentage of population with at least bachelor's degree education in the United States with a correlation coefficient (R) of -0.127 and weighted average of 48.1%. Similarly, the statistical analysis conducted on geographies consisting of 64,809,883 people shows a weak negative correlation between the proportion of Chinese and percentage of population with at least bachelor's degree education in the United States with a correlation coefficient (R) of -0.233 and weighted average of 38.5%, a difference of 25.2%.
Bachelor's Degree Correlation Summary
| Measurement | Immigrants from Eastern Asia | Chinese |
| Minimum | 9.0% | 3.8% |
| Maximum | 91.0% | 62.0% |
| Range | 81.9% | 58.3% |
| Mean | 51.7% | 35.8% |
| Median | 53.6% | 36.9% |
| Interquartile 25% (IQ1) | 43.4% | 30.9% |
| Interquartile 75% (IQ3) | 60.3% | 40.3% |
| Interquartile Range (IQR) | 16.9% | 9.4% |
| Standard Deviation (Sample) | 13.9% | 10.8% |
| Standard Deviation (Population) | 13.8% | 10.7% |
Similar Demographics by Bachelor's Degree
Demographics Similar to Immigrants from Eastern Asia by Bachelor's Degree
In terms of bachelor's degree, the demographic groups most similar to Immigrants from Eastern Asia are Immigrants from Hong Kong (48.2%, a difference of 0.14%), Immigrants from South Central Asia (48.3%, a difference of 0.42%), Soviet Union (47.9%, a difference of 0.46%), Immigrants from China (48.4%, a difference of 0.56%), and Immigrants from Australia (48.5%, a difference of 0.74%).
| Demographics | Rating | Rank | Bachelor's Degree |
| Thais | 100.0 /100 | #8 | Exceptional 50.1% |
| Immigrants | Israel | 100.0 /100 | #9 | Exceptional 50.0% |
| Cypriots | 100.0 /100 | #10 | Exceptional 49.0% |
| Immigrants | Australia | 100.0 /100 | #11 | Exceptional 48.5% |
| Immigrants | China | 100.0 /100 | #12 | Exceptional 48.4% |
| Immigrants | South Central Asia | 100.0 /100 | #13 | Exceptional 48.3% |
| Immigrants | Hong Kong | 100.0 /100 | #14 | Exceptional 48.2% |
| Immigrants | Eastern Asia | 100.0 /100 | #15 | Exceptional 48.1% |
| Soviet Union | 100.0 /100 | #16 | Exceptional 47.9% |
| Eastern Europeans | 100.0 /100 | #17 | Exceptional 47.5% |
| Indians (Asian) | 100.0 /100 | #18 | Exceptional 47.4% |
| Cambodians | 100.0 /100 | #19 | Exceptional 47.2% |
| Immigrants | Switzerland | 100.0 /100 | #20 | Exceptional 47.1% |
| Immigrants | Ireland | 100.0 /100 | #21 | Exceptional 47.1% |
| Immigrants | Belgium | 100.0 /100 | #22 | Exceptional 47.0% |
Demographics Similar to Chinese by Bachelor's Degree
In terms of bachelor's degree, the demographic groups most similar to Chinese are Vietnamese (38.5%, a difference of 0.0%), Uruguayan (38.4%, a difference of 0.090%), Colombian (38.4%, a difference of 0.17%), Immigrants from Germany (38.6%, a difference of 0.33%), and Peruvian (38.3%, a difference of 0.34%).
| Demographics | Rating | Rank | Bachelor's Degree |
| Sudanese | 76.4 /100 | #152 | Good 38.9% |
| Slavs | 75.9 /100 | #153 | Good 38.9% |
| Canadians | 75.0 /100 | #154 | Good 38.8% |
| Immigrants | Kenya | 73.8 /100 | #155 | Good 38.8% |
| Kenyans | 72.5 /100 | #156 | Good 38.7% |
| Immigrants | South America | 70.1 /100 | #157 | Good 38.6% |
| Immigrants | Germany | 69.6 /100 | #158 | Good 38.6% |
| Chinese | 66.6 /100 | #159 | Good 38.5% |
| Vietnamese | 66.6 /100 | #160 | Good 38.5% |
| Uruguayans | 65.8 /100 | #161 | Good 38.4% |
| Colombians | 65.0 /100 | #162 | Good 38.4% |
| Peruvians | 63.4 /100 | #163 | Good 38.3% |
| Hungarians | 62.1 /100 | #164 | Good 38.3% |
| Sri Lankans | 59.1 /100 | #165 | Average 38.2% |
| Somalis | 58.6 /100 | #166 | Average 38.1% |