Immigrants from Caribbean vs Japanese Bachelor's Degree
COMPARE
Immigrants from Caribbean
Japanese
Bachelor's Degree
Bachelor's Degree Comparison
Immigrants from Caribbean
Japanese
31.4%
BACHELOR'S DEGREE
0.1/ 100
METRIC RATING
282nd/ 347
METRIC RANK
33.3%
BACHELOR'S DEGREE
0.7/ 100
METRIC RATING
251st/ 347
METRIC RANK
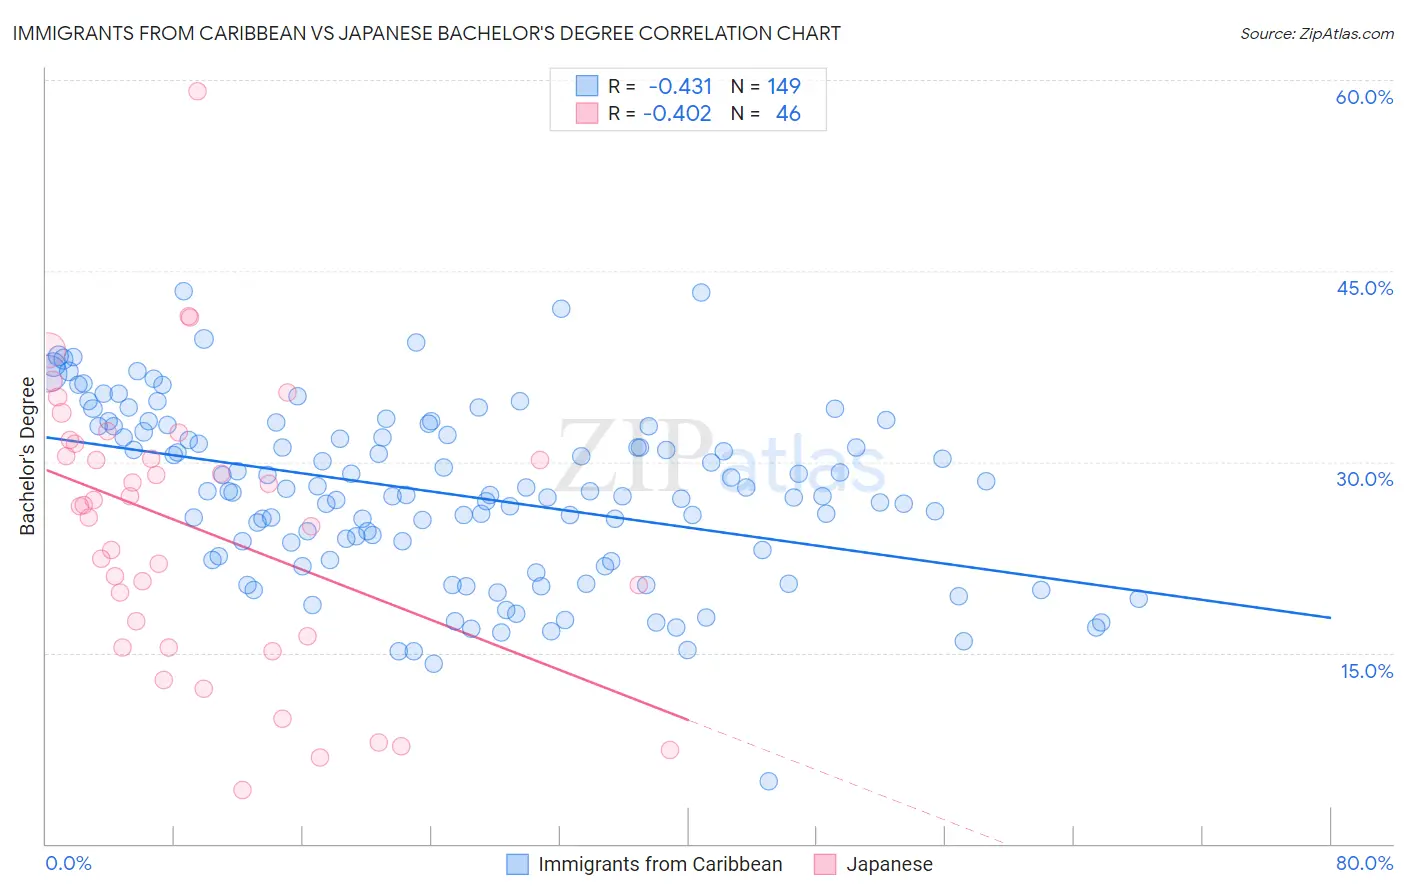
Immigrants from Caribbean vs Japanese Bachelor's Degree Correlation Chart
The statistical analysis conducted on geographies consisting of 450,021,690 people shows a moderate negative correlation between the proportion of Immigrants from Caribbean and percentage of population with at least bachelor's degree education in the United States with a correlation coefficient (R) of -0.431 and weighted average of 31.4%. Similarly, the statistical analysis conducted on geographies consisting of 249,171,435 people shows a moderate negative correlation between the proportion of Japanese and percentage of population with at least bachelor's degree education in the United States with a correlation coefficient (R) of -0.402 and weighted average of 33.3%, a difference of 6.1%.
Bachelor's Degree Correlation Summary
| Measurement | Immigrants from Caribbean | Japanese |
| Minimum | 4.9% | 4.3% |
| Maximum | 43.4% | 59.2% |
| Range | 38.5% | 54.9% |
| Mean | 27.5% | 24.8% |
| Median | 27.6% | 26.5% |
| Interquartile 25% (IQ1) | 22.5% | 16.3% |
| Interquartile 75% (IQ3) | 32.6% | 31.5% |
| Interquartile Range (IQR) | 10.1% | 15.1% |
| Standard Deviation (Sample) | 6.8% | 11.0% |
| Standard Deviation (Population) | 6.8% | 10.8% |
Similar Demographics by Bachelor's Degree
Demographics Similar to Immigrants from Caribbean by Bachelor's Degree
In terms of bachelor's degree, the demographic groups most similar to Immigrants from Caribbean are Blackfeet (31.5%, a difference of 0.15%), Honduran (31.3%, a difference of 0.28%), Haitian (31.3%, a difference of 0.31%), Aleut (31.3%, a difference of 0.32%), and Immigrants from El Salvador (31.3%, a difference of 0.38%).
| Demographics | Rating | Rank | Bachelor's Degree |
| Samoans | 0.1 /100 | #275 | Tragic 31.8% |
| Salvadorans | 0.1 /100 | #276 | Tragic 31.8% |
| Dominicans | 0.1 /100 | #277 | Tragic 31.8% |
| Marshallese | 0.1 /100 | #278 | Tragic 31.7% |
| Hawaiians | 0.1 /100 | #279 | Tragic 31.6% |
| Immigrants | Laos | 0.1 /100 | #280 | Tragic 31.6% |
| Blackfeet | 0.1 /100 | #281 | Tragic 31.5% |
| Immigrants | Caribbean | 0.1 /100 | #282 | Tragic 31.4% |
| Hondurans | 0.1 /100 | #283 | Tragic 31.3% |
| Haitians | 0.1 /100 | #284 | Tragic 31.3% |
| Aleuts | 0.1 /100 | #285 | Tragic 31.3% |
| Immigrants | El Salvador | 0.1 /100 | #286 | Tragic 31.3% |
| Ottawa | 0.1 /100 | #287 | Tragic 31.1% |
| Guatemalans | 0.1 /100 | #288 | Tragic 31.0% |
| Puerto Ricans | 0.1 /100 | #289 | Tragic 31.0% |
Demographics Similar to Japanese by Bachelor's Degree
In terms of bachelor's degree, the demographic groups most similar to Japanese are Immigrants from Bahamas (33.3%, a difference of 0.070%), U.S. Virgin Islander (33.2%, a difference of 0.28%), Native Hawaiian (33.2%, a difference of 0.34%), Iroquois (33.2%, a difference of 0.36%), and Nicaraguan (33.1%, a difference of 0.54%).
| Demographics | Rating | Rank | Bachelor's Degree |
| Delaware | 1.2 /100 | #244 | Tragic 33.8% |
| Immigrants | Fiji | 1.2 /100 | #245 | Tragic 33.7% |
| Jamaicans | 1.0 /100 | #246 | Tragic 33.6% |
| Immigrants | Congo | 1.0 /100 | #247 | Tragic 33.6% |
| Cree | 1.0 /100 | #248 | Tragic 33.6% |
| Immigrants | Liberia | 0.9 /100 | #249 | Tragic 33.5% |
| Indonesians | 0.9 /100 | #250 | Tragic 33.5% |
| Japanese | 0.7 /100 | #251 | Tragic 33.3% |
| Immigrants | Bahamas | 0.7 /100 | #252 | Tragic 33.3% |
| U.S. Virgin Islanders | 0.7 /100 | #253 | Tragic 33.2% |
| Native Hawaiians | 0.7 /100 | #254 | Tragic 33.2% |
| Iroquois | 0.7 /100 | #255 | Tragic 33.2% |
| Nicaraguans | 0.6 /100 | #256 | Tragic 33.1% |
| Spanish Americans | 0.6 /100 | #257 | Tragic 33.1% |
| French American Indians | 0.6 /100 | #258 | Tragic 33.1% |