Samoan vs Hawaiian GED/Equivalency
COMPARE
Samoan
Hawaiian
GED/Equivalency
GED/Equivalency Comparison
Samoans
Hawaiians
84.9%
GED/EQUIVALENCY
13.7/ 100
METRIC RATING
206th/ 347
METRIC RANK
85.0%
GED/EQUIVALENCY
15.2/ 100
METRIC RATING
204th/ 347
METRIC RANK
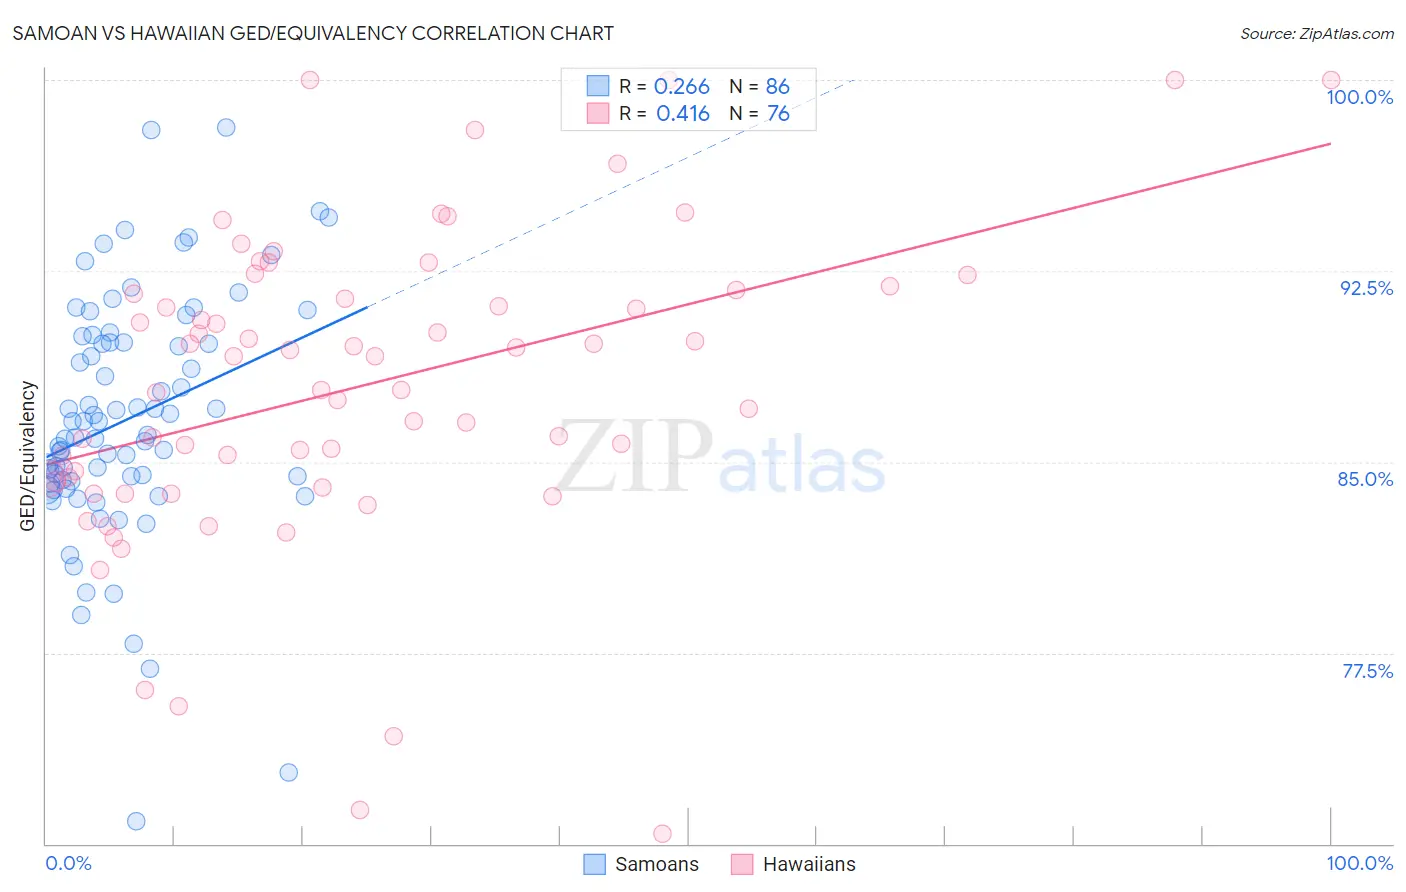
Samoan vs Hawaiian GED/Equivalency Correlation Chart
The statistical analysis conducted on geographies consisting of 225,205,484 people shows a weak positive correlation between the proportion of Samoans and percentage of population with at least ged/equivalency education in the United States with a correlation coefficient (R) of 0.266 and weighted average of 84.9%. Similarly, the statistical analysis conducted on geographies consisting of 327,620,955 people shows a moderate positive correlation between the proportion of Hawaiians and percentage of population with at least ged/equivalency education in the United States with a correlation coefficient (R) of 0.416 and weighted average of 85.0%, a difference of 0.070%.
GED/Equivalency Correlation Summary
| Measurement | Samoan | Hawaiian |
| Minimum | 70.9% | 70.4% |
| Maximum | 98.1% | 100.0% |
| Range | 27.3% | 29.6% |
| Mean | 86.7% | 87.9% |
| Median | 86.3% | 88.5% |
| Interquartile 25% (IQ1) | 84.2% | 84.3% |
| Interquartile 75% (IQ3) | 89.7% | 91.7% |
| Interquartile Range (IQR) | 5.5% | 7.4% |
| Standard Deviation (Sample) | 4.8% | 6.1% |
| Standard Deviation (Population) | 4.8% | 6.0% |
Demographics Similar to Samoans and Hawaiians by GED/Equivalency
In terms of ged/equivalency, the demographic groups most similar to Samoans are Hmong (84.9%, a difference of 0.020%), Liberian (85.0%, a difference of 0.040%), Marshallese (84.9%, a difference of 0.050%), Colombian (84.9%, a difference of 0.060%), and Panamanian (85.0%, a difference of 0.070%). Similarly, the demographic groups most similar to Hawaiians are Panamanian (85.0%, a difference of 0.0%), Uruguayan (85.0%, a difference of 0.030%), Portuguese (85.0%, a difference of 0.030%), Cree (85.0%, a difference of 0.030%), and Liberian (85.0%, a difference of 0.030%).
| Demographics | Rating | Rank | GED/Equivalency |
| Chippewa | 20.8 /100 | #195 | Fair 85.2% |
| Tongans | 20.7 /100 | #196 | Fair 85.2% |
| Costa Ricans | 20.4 /100 | #197 | Fair 85.2% |
| Immigrants | Africa | 17.5 /100 | #198 | Poor 85.1% |
| Somalis | 16.4 /100 | #199 | Poor 85.0% |
| Uruguayans | 16.0 /100 | #200 | Poor 85.0% |
| Portuguese | 15.9 /100 | #201 | Poor 85.0% |
| Cree | 15.9 /100 | #202 | Poor 85.0% |
| Panamanians | 15.3 /100 | #203 | Poor 85.0% |
| Hawaiians | 15.2 /100 | #204 | Poor 85.0% |
| Liberians | 14.6 /100 | #205 | Poor 85.0% |
| Samoans | 13.7 /100 | #206 | Poor 84.9% |
| Hmong | 13.1 /100 | #207 | Poor 84.9% |
| Marshallese | 12.5 /100 | #208 | Poor 84.9% |
| Colombians | 12.3 /100 | #209 | Poor 84.9% |
| Immigrants | Cameroon | 12.1 /100 | #210 | Poor 84.9% |
| South Americans | 10.9 /100 | #211 | Poor 84.8% |
| Immigrants | Somalia | 10.6 /100 | #212 | Poor 84.8% |
| Immigrants | Philippines | 10.0 /100 | #213 | Poor 84.8% |
| Osage | 9.5 /100 | #214 | Tragic 84.8% |
| Peruvians | 9.2 /100 | #215 | Tragic 84.7% |