Scandinavian vs Hawaiian GED/Equivalency
COMPARE
Scandinavian
Hawaiian
GED/Equivalency
GED/Equivalency Comparison
Scandinavians
Hawaiians
87.9%
GED/EQUIVALENCY
99.3/ 100
METRIC RATING
60th/ 347
METRIC RANK
85.0%
GED/EQUIVALENCY
15.2/ 100
METRIC RATING
204th/ 347
METRIC RANK
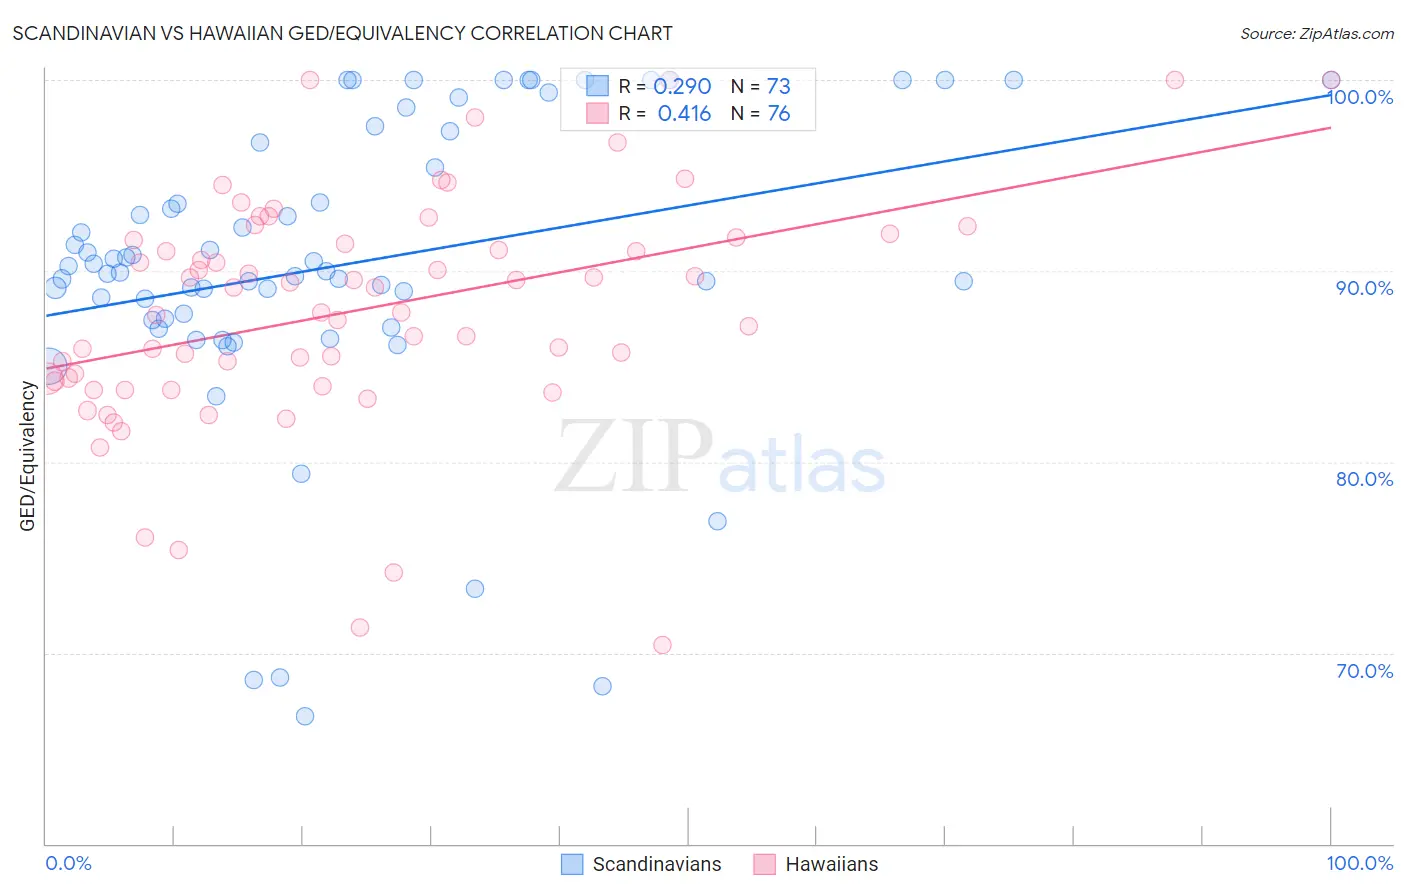
Scandinavian vs Hawaiian GED/Equivalency Correlation Chart
The statistical analysis conducted on geographies consisting of 472,660,435 people shows a weak positive correlation between the proportion of Scandinavians and percentage of population with at least ged/equivalency education in the United States with a correlation coefficient (R) of 0.290 and weighted average of 87.9%. Similarly, the statistical analysis conducted on geographies consisting of 327,620,955 people shows a moderate positive correlation between the proportion of Hawaiians and percentage of population with at least ged/equivalency education in the United States with a correlation coefficient (R) of 0.416 and weighted average of 85.0%, a difference of 3.4%.
GED/Equivalency Correlation Summary
| Measurement | Scandinavian | Hawaiian |
| Minimum | 66.7% | 70.4% |
| Maximum | 100.0% | 100.0% |
| Range | 33.3% | 29.6% |
| Mean | 90.3% | 87.9% |
| Median | 90.0% | 88.5% |
| Interquartile 25% (IQ1) | 87.5% | 84.3% |
| Interquartile 75% (IQ3) | 97.0% | 91.7% |
| Interquartile Range (IQR) | 9.6% | 7.4% |
| Standard Deviation (Sample) | 7.9% | 6.1% |
| Standard Deviation (Population) | 7.8% | 6.0% |
Similar Demographics by GED/Equivalency
Demographics Similar to Scandinavians by GED/Equivalency
In terms of ged/equivalency, the demographic groups most similar to Scandinavians are European (87.9%, a difference of 0.0%), Serbian (87.9%, a difference of 0.010%), Immigrants from Czechoslovakia (87.9%, a difference of 0.020%), Northern European (87.9%, a difference of 0.020%), and German (87.9%, a difference of 0.020%).
| Demographics | Rating | Rank | GED/Equivalency |
| Immigrants | South Africa | 99.4 /100 | #53 | Exceptional 88.0% |
| Soviet Union | 99.4 /100 | #54 | Exceptional 88.0% |
| New Zealanders | 99.4 /100 | #55 | Exceptional 88.0% |
| Immigrants | Denmark | 99.4 /100 | #56 | Exceptional 88.0% |
| Immigrants | Czechoslovakia | 99.3 /100 | #57 | Exceptional 87.9% |
| Northern Europeans | 99.3 /100 | #58 | Exceptional 87.9% |
| Serbians | 99.3 /100 | #59 | Exceptional 87.9% |
| Scandinavians | 99.3 /100 | #60 | Exceptional 87.9% |
| Europeans | 99.3 /100 | #61 | Exceptional 87.9% |
| Germans | 99.3 /100 | #62 | Exceptional 87.9% |
| Immigrants | Turkey | 99.2 /100 | #63 | Exceptional 87.9% |
| Immigrants | Canada | 99.2 /100 | #64 | Exceptional 87.9% |
| Immigrants | North America | 99.1 /100 | #65 | Exceptional 87.8% |
| Immigrants | Bulgaria | 99.1 /100 | #66 | Exceptional 87.8% |
| British | 99.1 /100 | #67 | Exceptional 87.8% |
Demographics Similar to Hawaiians by GED/Equivalency
In terms of ged/equivalency, the demographic groups most similar to Hawaiians are Panamanian (85.0%, a difference of 0.0%), Uruguayan (85.0%, a difference of 0.030%), Portuguese (85.0%, a difference of 0.030%), Cree (85.0%, a difference of 0.030%), and Liberian (85.0%, a difference of 0.030%).
| Demographics | Rating | Rank | GED/Equivalency |
| Costa Ricans | 20.4 /100 | #197 | Fair 85.2% |
| Immigrants | Africa | 17.5 /100 | #198 | Poor 85.1% |
| Somalis | 16.4 /100 | #199 | Poor 85.0% |
| Uruguayans | 16.0 /100 | #200 | Poor 85.0% |
| Portuguese | 15.9 /100 | #201 | Poor 85.0% |
| Cree | 15.9 /100 | #202 | Poor 85.0% |
| Panamanians | 15.3 /100 | #203 | Poor 85.0% |
| Hawaiians | 15.2 /100 | #204 | Poor 85.0% |
| Liberians | 14.6 /100 | #205 | Poor 85.0% |
| Samoans | 13.7 /100 | #206 | Poor 84.9% |
| Hmong | 13.1 /100 | #207 | Poor 84.9% |
| Marshallese | 12.5 /100 | #208 | Poor 84.9% |
| Colombians | 12.3 /100 | #209 | Poor 84.9% |
| Immigrants | Cameroon | 12.1 /100 | #210 | Poor 84.9% |
| South Americans | 10.9 /100 | #211 | Poor 84.8% |