Immigrants from Cabo Verde vs Japanese Bachelor's Degree
COMPARE
Immigrants from Cabo Verde
Japanese
Bachelor's Degree
Bachelor's Degree Comparison
Immigrants from Cabo Verde
Japanese
29.2%
BACHELOR'S DEGREE
0.0/ 100
METRIC RATING
315th/ 347
METRIC RANK
33.3%
BACHELOR'S DEGREE
0.7/ 100
METRIC RATING
251st/ 347
METRIC RANK
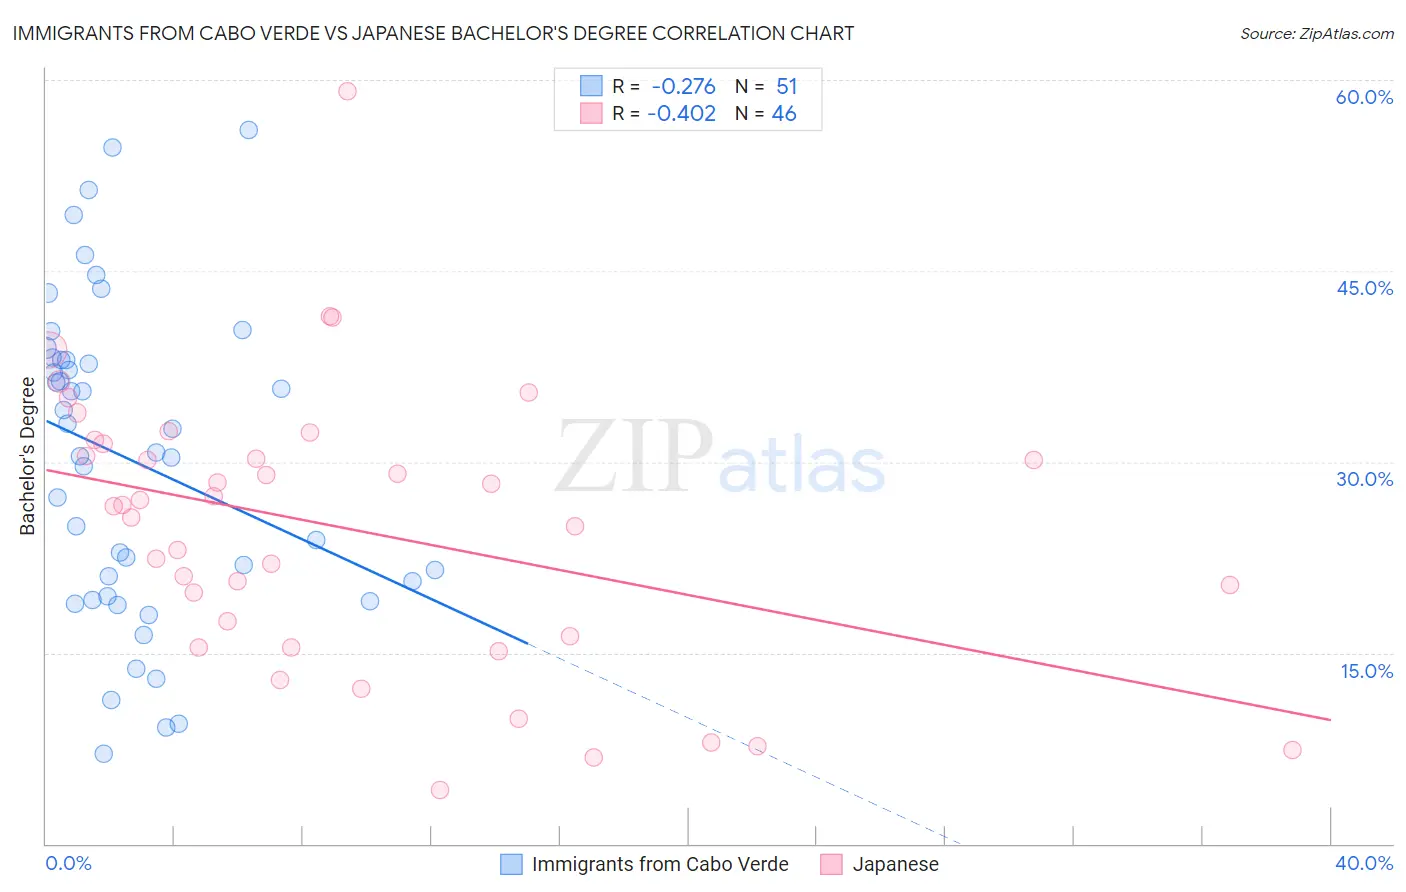
Immigrants from Cabo Verde vs Japanese Bachelor's Degree Correlation Chart
The statistical analysis conducted on geographies consisting of 38,158,316 people shows a weak negative correlation between the proportion of Immigrants from Cabo Verde and percentage of population with at least bachelor's degree education in the United States with a correlation coefficient (R) of -0.276 and weighted average of 29.2%. Similarly, the statistical analysis conducted on geographies consisting of 249,171,435 people shows a moderate negative correlation between the proportion of Japanese and percentage of population with at least bachelor's degree education in the United States with a correlation coefficient (R) of -0.402 and weighted average of 33.3%, a difference of 14.0%.
Bachelor's Degree Correlation Summary
| Measurement | Immigrants from Cabo Verde | Japanese |
| Minimum | 7.1% | 4.3% |
| Maximum | 56.1% | 59.2% |
| Range | 49.0% | 54.9% |
| Mean | 30.1% | 24.8% |
| Median | 30.8% | 26.5% |
| Interquartile 25% (IQ1) | 19.4% | 16.3% |
| Interquartile 75% (IQ3) | 38.0% | 31.5% |
| Interquartile Range (IQR) | 18.6% | 15.1% |
| Standard Deviation (Sample) | 12.3% | 11.0% |
| Standard Deviation (Population) | 12.1% | 10.8% |
Similar Demographics by Bachelor's Degree
Demographics Similar to Immigrants from Cabo Verde by Bachelor's Degree
In terms of bachelor's degree, the demographic groups most similar to Immigrants from Cabo Verde are Shoshone (29.3%, a difference of 0.080%), Alaska Native (29.4%, a difference of 0.37%), Seminole (29.4%, a difference of 0.56%), Choctaw (29.4%, a difference of 0.61%), and Sioux (29.1%, a difference of 0.62%).
| Demographics | Rating | Rank | Bachelor's Degree |
| Cajuns | 0.0 /100 | #308 | Tragic 29.6% |
| Hispanics or Latinos | 0.0 /100 | #309 | Tragic 29.6% |
| Cheyenne | 0.0 /100 | #310 | Tragic 29.4% |
| Choctaw | 0.0 /100 | #311 | Tragic 29.4% |
| Seminole | 0.0 /100 | #312 | Tragic 29.4% |
| Alaska Natives | 0.0 /100 | #313 | Tragic 29.4% |
| Shoshone | 0.0 /100 | #314 | Tragic 29.3% |
| Immigrants | Cabo Verde | 0.0 /100 | #315 | Tragic 29.2% |
| Sioux | 0.0 /100 | #316 | Tragic 29.1% |
| Colville | 0.0 /100 | #317 | Tragic 29.0% |
| Yaqui | 0.0 /100 | #318 | Tragic 29.0% |
| Creek | 0.0 /100 | #319 | Tragic 28.9% |
| Kiowa | 0.0 /100 | #320 | Tragic 28.8% |
| Alaskan Athabascans | 0.0 /100 | #321 | Tragic 28.8% |
| Tsimshian | 0.0 /100 | #322 | Tragic 28.8% |
Demographics Similar to Japanese by Bachelor's Degree
In terms of bachelor's degree, the demographic groups most similar to Japanese are Immigrants from Bahamas (33.3%, a difference of 0.070%), U.S. Virgin Islander (33.2%, a difference of 0.28%), Native Hawaiian (33.2%, a difference of 0.34%), Iroquois (33.2%, a difference of 0.36%), and Nicaraguan (33.1%, a difference of 0.54%).
| Demographics | Rating | Rank | Bachelor's Degree |
| Delaware | 1.2 /100 | #244 | Tragic 33.8% |
| Immigrants | Fiji | 1.2 /100 | #245 | Tragic 33.7% |
| Jamaicans | 1.0 /100 | #246 | Tragic 33.6% |
| Immigrants | Congo | 1.0 /100 | #247 | Tragic 33.6% |
| Cree | 1.0 /100 | #248 | Tragic 33.6% |
| Immigrants | Liberia | 0.9 /100 | #249 | Tragic 33.5% |
| Indonesians | 0.9 /100 | #250 | Tragic 33.5% |
| Japanese | 0.7 /100 | #251 | Tragic 33.3% |
| Immigrants | Bahamas | 0.7 /100 | #252 | Tragic 33.3% |
| U.S. Virgin Islanders | 0.7 /100 | #253 | Tragic 33.2% |
| Native Hawaiians | 0.7 /100 | #254 | Tragic 33.2% |
| Iroquois | 0.7 /100 | #255 | Tragic 33.2% |
| Nicaraguans | 0.6 /100 | #256 | Tragic 33.1% |
| Spanish Americans | 0.6 /100 | #257 | Tragic 33.1% |
| French American Indians | 0.6 /100 | #258 | Tragic 33.1% |