Immigrants from Cabo Verde vs Japanese In Labor Force | Age 30-34
COMPARE
Immigrants from Cabo Verde
Japanese
In Labor Force | Age 30-34
In Labor Force | Age 30-34 Comparison
Immigrants from Cabo Verde
Japanese
86.1%
IN LABOR FORCE | AGE 30-34
100.0/ 100
METRIC RATING
14th/ 347
METRIC RANK
84.3%
IN LABOR FORCE | AGE 30-34
8.8/ 100
METRIC RATING
211th/ 347
METRIC RANK
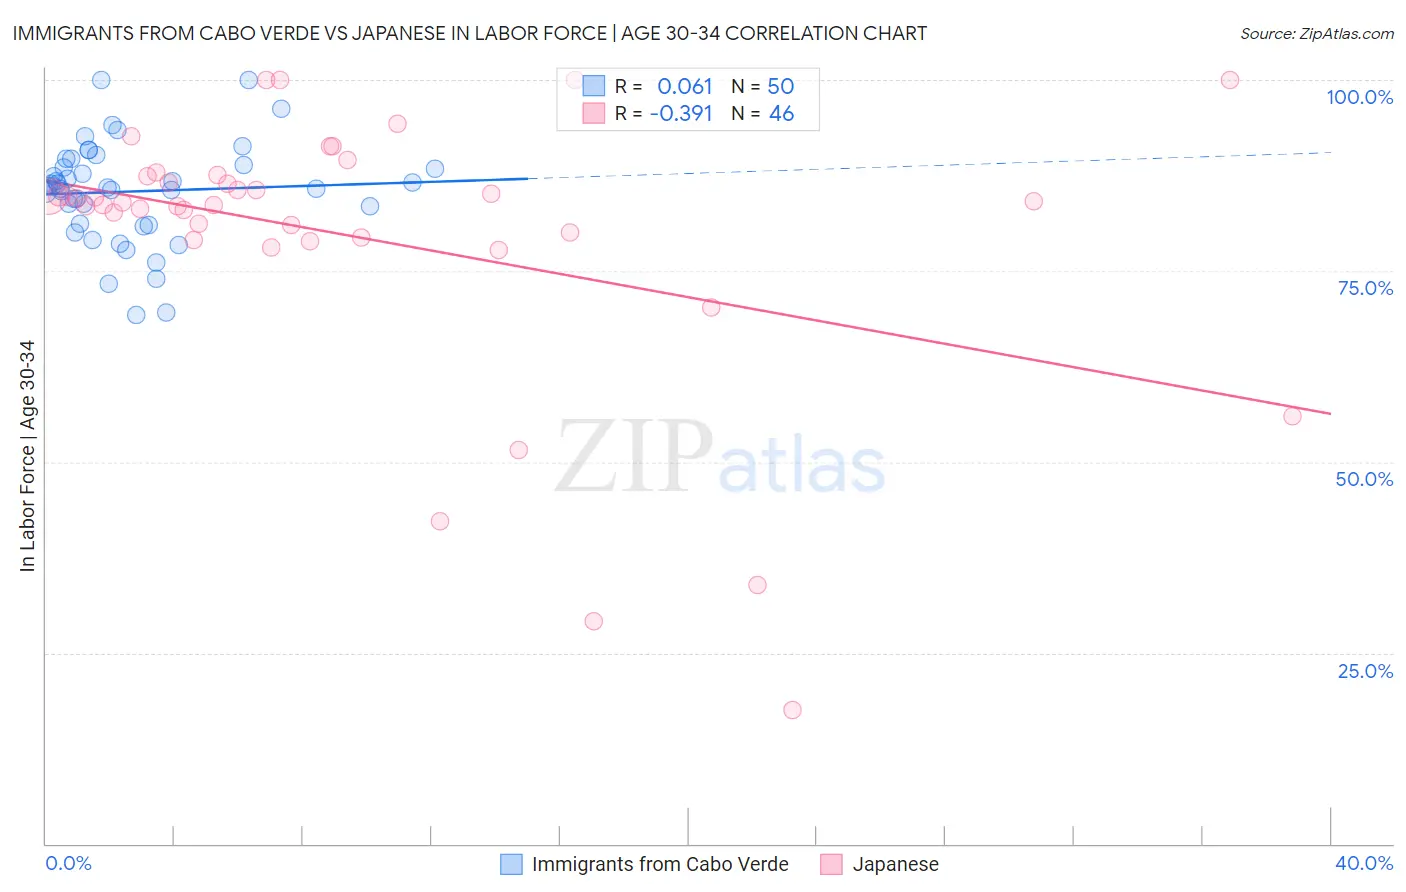
Immigrants from Cabo Verde vs Japanese In Labor Force | Age 30-34 Correlation Chart
The statistical analysis conducted on geographies consisting of 38,153,074 people shows a slight positive correlation between the proportion of Immigrants from Cabo Verde and labor force participation rate among population between the ages 30 and 34 in the United States with a correlation coefficient (R) of 0.061 and weighted average of 86.1%. Similarly, the statistical analysis conducted on geographies consisting of 249,105,217 people shows a mild negative correlation between the proportion of Japanese and labor force participation rate among population between the ages 30 and 34 in the United States with a correlation coefficient (R) of -0.391 and weighted average of 84.3%, a difference of 2.1%.
In Labor Force | Age 30-34 Correlation Summary
| Measurement | Immigrants from Cabo Verde | Japanese |
| Minimum | 69.2% | 17.5% |
| Maximum | 100.0% | 100.0% |
| Range | 30.8% | 82.5% |
| Mean | 85.4% | 79.6% |
| Median | 86.0% | 84.0% |
| Interquartile 25% (IQ1) | 81.2% | 79.4% |
| Interquartile 75% (IQ3) | 88.8% | 87.3% |
| Interquartile Range (IQR) | 7.6% | 8.0% |
| Standard Deviation (Sample) | 6.6% | 17.9% |
| Standard Deviation (Population) | 6.5% | 17.7% |
Similar Demographics by In Labor Force | Age 30-34
Demographics Similar to Immigrants from Cabo Verde by In Labor Force | Age 30-34
In terms of in labor force | age 30-34, the demographic groups most similar to Immigrants from Cabo Verde are Immigrants from Croatia (86.1%, a difference of 0.010%), Immigrants from Albania (86.1%, a difference of 0.010%), Bolivian (86.1%, a difference of 0.020%), Latvian (86.0%, a difference of 0.040%), and Immigrants from Cameroon (86.0%, a difference of 0.050%).
| Demographics | Rating | Rank | In Labor Force | Age 30-34 |
| Immigrants | Bolivia | 100.0 /100 | #7 | Exceptional 86.2% |
| Cambodians | 100.0 /100 | #8 | Exceptional 86.2% |
| Immigrants | Somalia | 100.0 /100 | #9 | Exceptional 86.2% |
| Immigrants | Serbia | 100.0 /100 | #10 | Exceptional 86.2% |
| Carpatho Rusyns | 100.0 /100 | #11 | Exceptional 86.2% |
| Bolivians | 100.0 /100 | #12 | Exceptional 86.1% |
| Immigrants | Croatia | 100.0 /100 | #13 | Exceptional 86.1% |
| Immigrants | Cabo Verde | 100.0 /100 | #14 | Exceptional 86.1% |
| Immigrants | Albania | 100.0 /100 | #15 | Exceptional 86.1% |
| Latvians | 100.0 /100 | #16 | Exceptional 86.0% |
| Immigrants | Cameroon | 100.0 /100 | #17 | Exceptional 86.0% |
| Immigrants | Sierra Leone | 100.0 /100 | #18 | Exceptional 86.0% |
| Sierra Leoneans | 100.0 /100 | #19 | Exceptional 86.0% |
| Bulgarians | 100.0 /100 | #20 | Exceptional 86.0% |
| Immigrants | Bulgaria | 100.0 /100 | #21 | Exceptional 86.0% |
Demographics Similar to Japanese by In Labor Force | Age 30-34
In terms of in labor force | age 30-34, the demographic groups most similar to Japanese are Arab (84.3%, a difference of 0.0%), Jamaican (84.3%, a difference of 0.0%), Indonesian (84.3%, a difference of 0.0%), Bangladeshi (84.3%, a difference of 0.010%), and Immigrants from Western Asia (84.3%, a difference of 0.010%).
| Demographics | Rating | Rank | In Labor Force | Age 30-34 |
| Ecuadorians | 14.2 /100 | #204 | Poor 84.4% |
| French | 13.8 /100 | #205 | Poor 84.4% |
| Lebanese | 10.6 /100 | #206 | Poor 84.4% |
| Bangladeshis | 9.4 /100 | #207 | Tragic 84.3% |
| Arabs | 8.9 /100 | #208 | Tragic 84.3% |
| Jamaicans | 8.8 /100 | #209 | Tragic 84.3% |
| Indonesians | 8.8 /100 | #210 | Tragic 84.3% |
| Japanese | 8.8 /100 | #211 | Tragic 84.3% |
| Immigrants | Western Asia | 8.2 /100 | #212 | Tragic 84.3% |
| Immigrants | Jamaica | 7.9 /100 | #213 | Tragic 84.3% |
| Immigrants | Germany | 7.2 /100 | #214 | Tragic 84.3% |
| Europeans | 7.2 /100 | #215 | Tragic 84.3% |
| Immigrants | Ecuador | 7.1 /100 | #216 | Tragic 84.3% |
| Immigrants | Trinidad and Tobago | 7.0 /100 | #217 | Tragic 84.3% |
| Immigrants | Panama | 6.3 /100 | #218 | Tragic 84.3% |