Ute vs Japanese Bachelor's Degree
COMPARE
Ute
Japanese
Bachelor's Degree
Bachelor's Degree Comparison
Ute
Japanese
30.9%
BACHELOR'S DEGREE
0.1/ 100
METRIC RATING
292nd/ 347
METRIC RANK
33.3%
BACHELOR'S DEGREE
0.7/ 100
METRIC RATING
251st/ 347
METRIC RANK
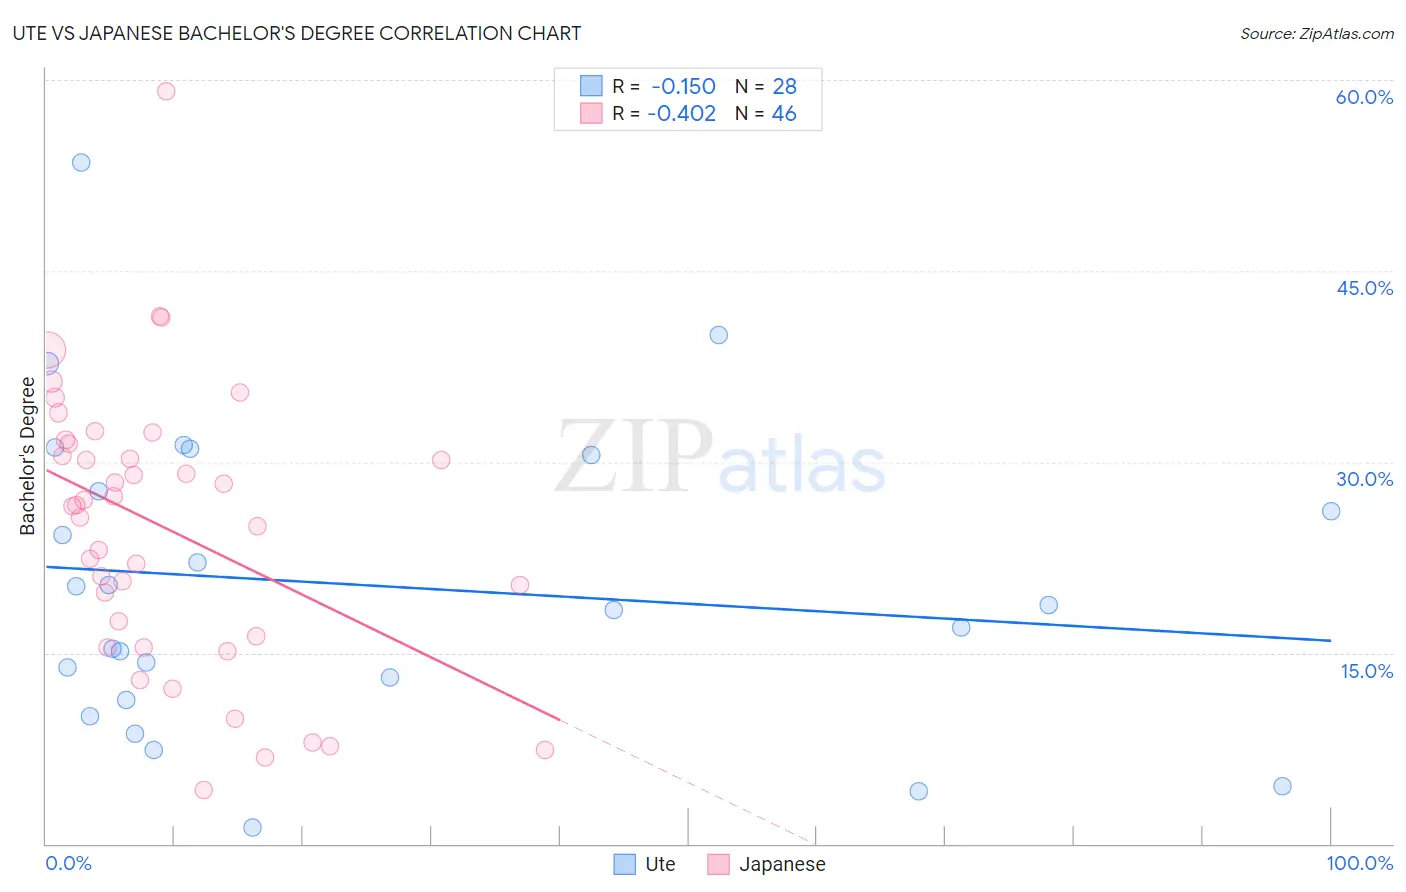
Ute vs Japanese Bachelor's Degree Correlation Chart
The statistical analysis conducted on geographies consisting of 55,667,997 people shows a poor negative correlation between the proportion of Ute and percentage of population with at least bachelor's degree education in the United States with a correlation coefficient (R) of -0.150 and weighted average of 30.9%. Similarly, the statistical analysis conducted on geographies consisting of 249,171,435 people shows a moderate negative correlation between the proportion of Japanese and percentage of population with at least bachelor's degree education in the United States with a correlation coefficient (R) of -0.402 and weighted average of 33.3%, a difference of 7.8%.
Bachelor's Degree Correlation Summary
| Measurement | Ute | Japanese |
| Minimum | 1.2% | 4.3% |
| Maximum | 53.5% | 59.2% |
| Range | 52.3% | 54.9% |
| Mean | 20.3% | 24.8% |
| Median | 18.6% | 26.5% |
| Interquartile 25% (IQ1) | 12.2% | 16.3% |
| Interquartile 75% (IQ3) | 29.1% | 31.5% |
| Interquartile Range (IQR) | 16.9% | 15.1% |
| Standard Deviation (Sample) | 12.1% | 11.0% |
| Standard Deviation (Population) | 11.8% | 10.8% |
Similar Demographics by Bachelor's Degree
Demographics Similar to Ute by Bachelor's Degree
In terms of bachelor's degree, the demographic groups most similar to Ute are Black/African American (30.9%, a difference of 0.080%), Cape Verdean (30.9%, a difference of 0.090%), Immigrants from Honduras (30.9%, a difference of 0.12%), Puerto Rican (31.0%, a difference of 0.16%), and Guatemalan (31.0%, a difference of 0.30%).
| Demographics | Rating | Rank | Bachelor's Degree |
| Aleuts | 0.1 /100 | #285 | Tragic 31.3% |
| Immigrants | El Salvador | 0.1 /100 | #286 | Tragic 31.3% |
| Ottawa | 0.1 /100 | #287 | Tragic 31.1% |
| Guatemalans | 0.1 /100 | #288 | Tragic 31.0% |
| Puerto Ricans | 0.1 /100 | #289 | Tragic 31.0% |
| Immigrants | Honduras | 0.1 /100 | #290 | Tragic 30.9% |
| Blacks/African Americans | 0.1 /100 | #291 | Tragic 30.9% |
| Ute | 0.1 /100 | #292 | Tragic 30.9% |
| Cape Verdeans | 0.1 /100 | #293 | Tragic 30.9% |
| Immigrants | Guatemala | 0.0 /100 | #294 | Tragic 30.8% |
| Immigrants | Dominican Republic | 0.0 /100 | #295 | Tragic 30.7% |
| Puget Sound Salish | 0.0 /100 | #296 | Tragic 30.7% |
| Immigrants | Haiti | 0.0 /100 | #297 | Tragic 30.6% |
| Chippewa | 0.0 /100 | #298 | Tragic 30.6% |
| Chickasaw | 0.0 /100 | #299 | Tragic 30.4% |
Demographics Similar to Japanese by Bachelor's Degree
In terms of bachelor's degree, the demographic groups most similar to Japanese are Immigrants from Bahamas (33.3%, a difference of 0.070%), U.S. Virgin Islander (33.2%, a difference of 0.28%), Native Hawaiian (33.2%, a difference of 0.34%), Iroquois (33.2%, a difference of 0.36%), and Nicaraguan (33.1%, a difference of 0.54%).
| Demographics | Rating | Rank | Bachelor's Degree |
| Delaware | 1.2 /100 | #244 | Tragic 33.8% |
| Immigrants | Fiji | 1.2 /100 | #245 | Tragic 33.7% |
| Jamaicans | 1.0 /100 | #246 | Tragic 33.6% |
| Immigrants | Congo | 1.0 /100 | #247 | Tragic 33.6% |
| Cree | 1.0 /100 | #248 | Tragic 33.6% |
| Immigrants | Liberia | 0.9 /100 | #249 | Tragic 33.5% |
| Indonesians | 0.9 /100 | #250 | Tragic 33.5% |
| Japanese | 0.7 /100 | #251 | Tragic 33.3% |
| Immigrants | Bahamas | 0.7 /100 | #252 | Tragic 33.3% |
| U.S. Virgin Islanders | 0.7 /100 | #253 | Tragic 33.2% |
| Native Hawaiians | 0.7 /100 | #254 | Tragic 33.2% |
| Iroquois | 0.7 /100 | #255 | Tragic 33.2% |
| Nicaraguans | 0.6 /100 | #256 | Tragic 33.1% |
| Spanish Americans | 0.6 /100 | #257 | Tragic 33.1% |
| French American Indians | 0.6 /100 | #258 | Tragic 33.1% |