Immigrants from Cabo Verde vs Hungarian Bachelor's Degree
COMPARE
Immigrants from Cabo Verde
Hungarian
Bachelor's Degree
Bachelor's Degree Comparison
Immigrants from Cabo Verde
Hungarians
29.2%
BACHELOR'S DEGREE
0.0/ 100
METRIC RATING
315th/ 347
METRIC RANK
38.3%
BACHELOR'S DEGREE
62.1/ 100
METRIC RATING
164th/ 347
METRIC RANK
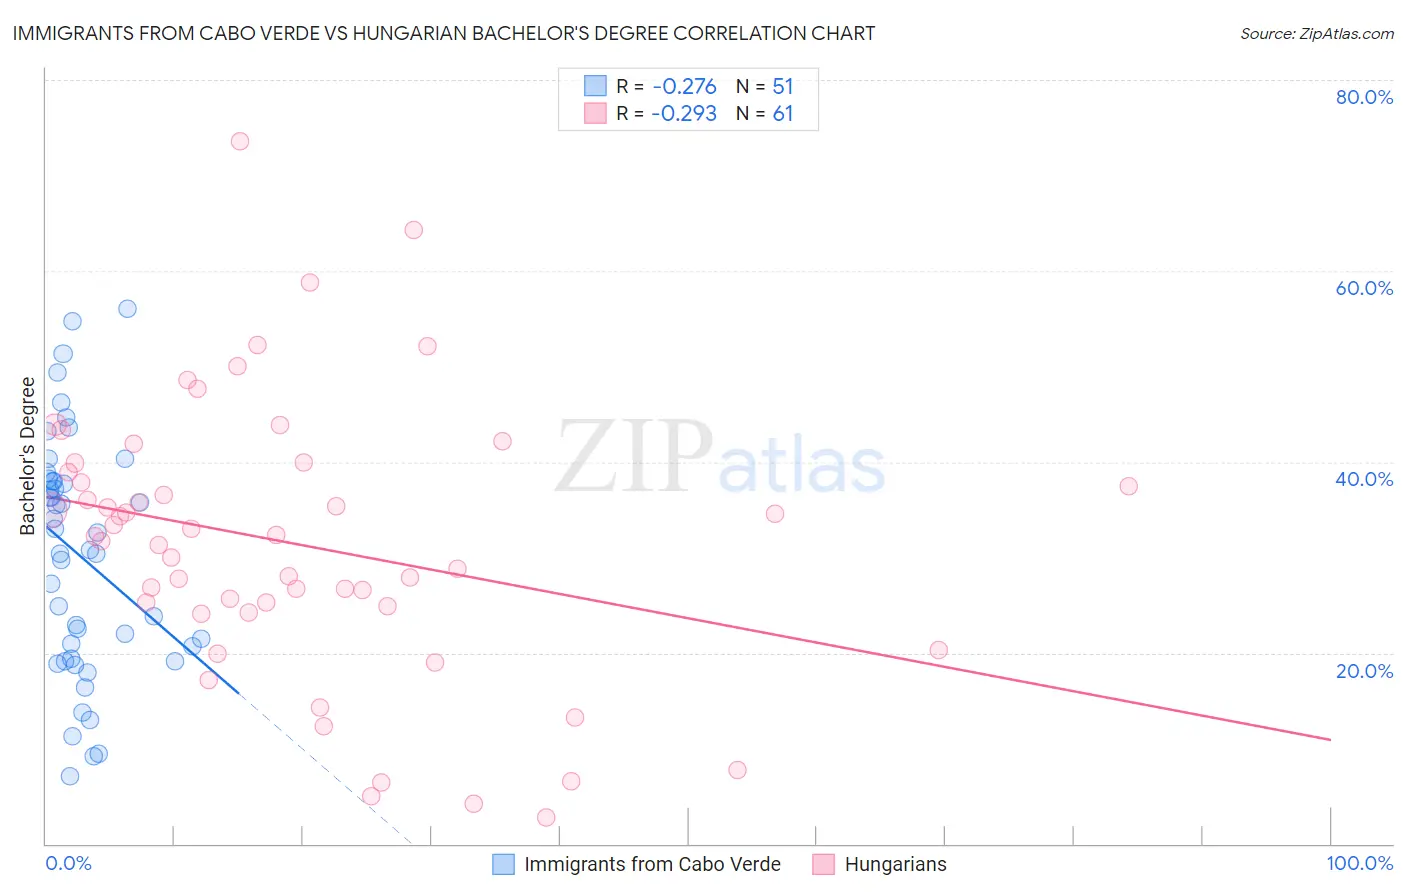
Immigrants from Cabo Verde vs Hungarian Bachelor's Degree Correlation Chart
The statistical analysis conducted on geographies consisting of 38,158,316 people shows a weak negative correlation between the proportion of Immigrants from Cabo Verde and percentage of population with at least bachelor's degree education in the United States with a correlation coefficient (R) of -0.276 and weighted average of 29.2%. Similarly, the statistical analysis conducted on geographies consisting of 486,195,655 people shows a weak negative correlation between the proportion of Hungarians and percentage of population with at least bachelor's degree education in the United States with a correlation coefficient (R) of -0.293 and weighted average of 38.3%, a difference of 30.9%.
Bachelor's Degree Correlation Summary
| Measurement | Immigrants from Cabo Verde | Hungarian |
| Minimum | 7.1% | 2.7% |
| Maximum | 56.1% | 73.6% |
| Range | 49.0% | 70.9% |
| Mean | 30.1% | 31.4% |
| Median | 30.8% | 32.2% |
| Interquartile 25% (IQ1) | 19.4% | 24.5% |
| Interquartile 75% (IQ3) | 38.0% | 39.4% |
| Interquartile Range (IQR) | 18.6% | 14.9% |
| Standard Deviation (Sample) | 12.3% | 14.5% |
| Standard Deviation (Population) | 12.1% | 14.3% |
Similar Demographics by Bachelor's Degree
Demographics Similar to Immigrants from Cabo Verde by Bachelor's Degree
In terms of bachelor's degree, the demographic groups most similar to Immigrants from Cabo Verde are Shoshone (29.3%, a difference of 0.080%), Alaska Native (29.4%, a difference of 0.37%), Seminole (29.4%, a difference of 0.56%), Choctaw (29.4%, a difference of 0.61%), and Sioux (29.1%, a difference of 0.62%).
| Demographics | Rating | Rank | Bachelor's Degree |
| Cajuns | 0.0 /100 | #308 | Tragic 29.6% |
| Hispanics or Latinos | 0.0 /100 | #309 | Tragic 29.6% |
| Cheyenne | 0.0 /100 | #310 | Tragic 29.4% |
| Choctaw | 0.0 /100 | #311 | Tragic 29.4% |
| Seminole | 0.0 /100 | #312 | Tragic 29.4% |
| Alaska Natives | 0.0 /100 | #313 | Tragic 29.4% |
| Shoshone | 0.0 /100 | #314 | Tragic 29.3% |
| Immigrants | Cabo Verde | 0.0 /100 | #315 | Tragic 29.2% |
| Sioux | 0.0 /100 | #316 | Tragic 29.1% |
| Colville | 0.0 /100 | #317 | Tragic 29.0% |
| Yaqui | 0.0 /100 | #318 | Tragic 29.0% |
| Creek | 0.0 /100 | #319 | Tragic 28.9% |
| Kiowa | 0.0 /100 | #320 | Tragic 28.8% |
| Alaskan Athabascans | 0.0 /100 | #321 | Tragic 28.8% |
| Tsimshian | 0.0 /100 | #322 | Tragic 28.8% |
Demographics Similar to Hungarians by Bachelor's Degree
In terms of bachelor's degree, the demographic groups most similar to Hungarians are Peruvian (38.3%, a difference of 0.14%), Sri Lankan (38.2%, a difference of 0.30%), Colombian (38.4%, a difference of 0.31%), Somali (38.1%, a difference of 0.35%), and Uruguayan (38.4%, a difference of 0.38%).
| Demographics | Rating | Rank | Bachelor's Degree |
| Immigrants | South America | 70.1 /100 | #157 | Good 38.6% |
| Immigrants | Germany | 69.6 /100 | #158 | Good 38.6% |
| Chinese | 66.6 /100 | #159 | Good 38.5% |
| Vietnamese | 66.6 /100 | #160 | Good 38.5% |
| Uruguayans | 65.8 /100 | #161 | Good 38.4% |
| Colombians | 65.0 /100 | #162 | Good 38.4% |
| Peruvians | 63.4 /100 | #163 | Good 38.3% |
| Hungarians | 62.1 /100 | #164 | Good 38.3% |
| Sri Lankans | 59.1 /100 | #165 | Average 38.2% |
| Somalis | 58.6 /100 | #166 | Average 38.1% |
| Scottish | 56.6 /100 | #167 | Average 38.1% |
| Danes | 56.2 /100 | #168 | Average 38.1% |
| Ghanaians | 55.3 /100 | #169 | Average 38.0% |
| Czechs | 54.4 /100 | #170 | Average 38.0% |
| Bermudans | 54.2 /100 | #171 | Average 38.0% |