Immigrants from Cabo Verde vs Haitian Bachelor's Degree
COMPARE
Immigrants from Cabo Verde
Haitian
Bachelor's Degree
Bachelor's Degree Comparison
Immigrants from Cabo Verde
Haitians
29.2%
BACHELOR'S DEGREE
0.0/ 100
METRIC RATING
315th/ 347
METRIC RANK
31.3%
BACHELOR'S DEGREE
0.1/ 100
METRIC RATING
284th/ 347
METRIC RANK
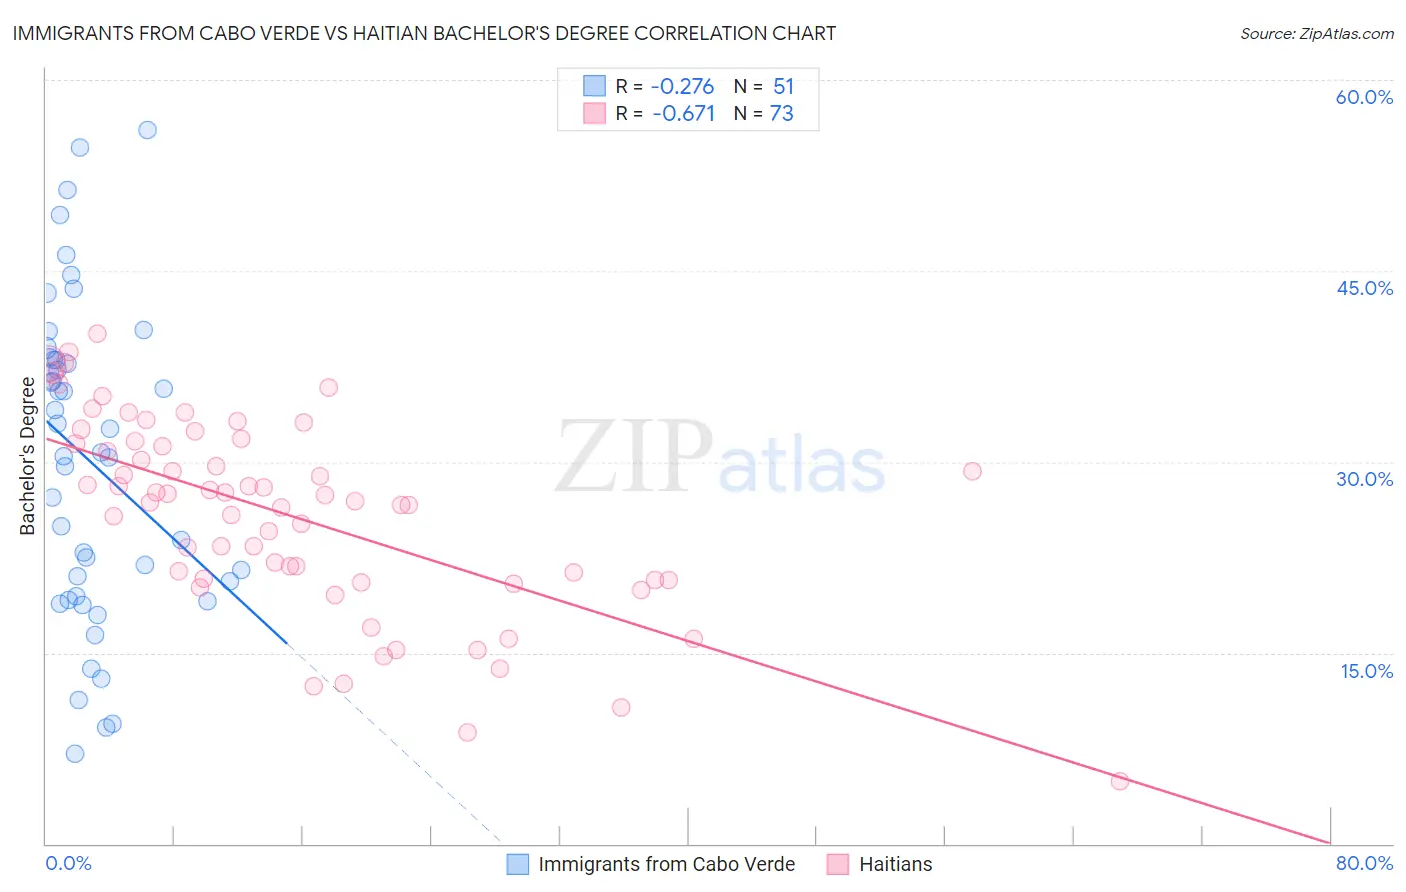
Immigrants from Cabo Verde vs Haitian Bachelor's Degree Correlation Chart
The statistical analysis conducted on geographies consisting of 38,158,316 people shows a weak negative correlation between the proportion of Immigrants from Cabo Verde and percentage of population with at least bachelor's degree education in the United States with a correlation coefficient (R) of -0.276 and weighted average of 29.2%. Similarly, the statistical analysis conducted on geographies consisting of 287,970,705 people shows a significant negative correlation between the proportion of Haitians and percentage of population with at least bachelor's degree education in the United States with a correlation coefficient (R) of -0.671 and weighted average of 31.3%, a difference of 7.1%.
Bachelor's Degree Correlation Summary
| Measurement | Immigrants from Cabo Verde | Haitian |
| Minimum | 7.1% | 4.9% |
| Maximum | 56.1% | 40.1% |
| Range | 49.0% | 35.1% |
| Mean | 30.1% | 25.8% |
| Median | 30.8% | 26.9% |
| Interquartile 25% (IQ1) | 19.4% | 20.7% |
| Interquartile 75% (IQ3) | 38.0% | 31.6% |
| Interquartile Range (IQR) | 18.6% | 10.8% |
| Standard Deviation (Sample) | 12.3% | 7.6% |
| Standard Deviation (Population) | 12.1% | 7.6% |
Similar Demographics by Bachelor's Degree
Demographics Similar to Immigrants from Cabo Verde by Bachelor's Degree
In terms of bachelor's degree, the demographic groups most similar to Immigrants from Cabo Verde are Shoshone (29.3%, a difference of 0.080%), Alaska Native (29.4%, a difference of 0.37%), Seminole (29.4%, a difference of 0.56%), Choctaw (29.4%, a difference of 0.61%), and Sioux (29.1%, a difference of 0.62%).
| Demographics | Rating | Rank | Bachelor's Degree |
| Cajuns | 0.0 /100 | #308 | Tragic 29.6% |
| Hispanics or Latinos | 0.0 /100 | #309 | Tragic 29.6% |
| Cheyenne | 0.0 /100 | #310 | Tragic 29.4% |
| Choctaw | 0.0 /100 | #311 | Tragic 29.4% |
| Seminole | 0.0 /100 | #312 | Tragic 29.4% |
| Alaska Natives | 0.0 /100 | #313 | Tragic 29.4% |
| Shoshone | 0.0 /100 | #314 | Tragic 29.3% |
| Immigrants | Cabo Verde | 0.0 /100 | #315 | Tragic 29.2% |
| Sioux | 0.0 /100 | #316 | Tragic 29.1% |
| Colville | 0.0 /100 | #317 | Tragic 29.0% |
| Yaqui | 0.0 /100 | #318 | Tragic 29.0% |
| Creek | 0.0 /100 | #319 | Tragic 28.9% |
| Kiowa | 0.0 /100 | #320 | Tragic 28.8% |
| Alaskan Athabascans | 0.0 /100 | #321 | Tragic 28.8% |
| Tsimshian | 0.0 /100 | #322 | Tragic 28.8% |
Demographics Similar to Haitians by Bachelor's Degree
In terms of bachelor's degree, the demographic groups most similar to Haitians are Aleut (31.3%, a difference of 0.010%), Honduran (31.3%, a difference of 0.030%), Immigrants from El Salvador (31.3%, a difference of 0.070%), Immigrants from Caribbean (31.4%, a difference of 0.31%), and Blackfeet (31.5%, a difference of 0.45%).
| Demographics | Rating | Rank | Bachelor's Degree |
| Dominicans | 0.1 /100 | #277 | Tragic 31.8% |
| Marshallese | 0.1 /100 | #278 | Tragic 31.7% |
| Hawaiians | 0.1 /100 | #279 | Tragic 31.6% |
| Immigrants | Laos | 0.1 /100 | #280 | Tragic 31.6% |
| Blackfeet | 0.1 /100 | #281 | Tragic 31.5% |
| Immigrants | Caribbean | 0.1 /100 | #282 | Tragic 31.4% |
| Hondurans | 0.1 /100 | #283 | Tragic 31.3% |
| Haitians | 0.1 /100 | #284 | Tragic 31.3% |
| Aleuts | 0.1 /100 | #285 | Tragic 31.3% |
| Immigrants | El Salvador | 0.1 /100 | #286 | Tragic 31.3% |
| Ottawa | 0.1 /100 | #287 | Tragic 31.1% |
| Guatemalans | 0.1 /100 | #288 | Tragic 31.0% |
| Puerto Ricans | 0.1 /100 | #289 | Tragic 31.0% |
| Immigrants | Honduras | 0.1 /100 | #290 | Tragic 30.9% |
| Blacks/African Americans | 0.1 /100 | #291 | Tragic 30.9% |