Immigrants from Cabo Verde vs Menominee Bachelor's Degree
COMPARE
Immigrants from Cabo Verde
Menominee
Bachelor's Degree
Bachelor's Degree Comparison
Immigrants from Cabo Verde
Menominee
29.2%
BACHELOR'S DEGREE
0.0/ 100
METRIC RATING
315th/ 347
METRIC RANK
27.3%
BACHELOR'S DEGREE
0.0/ 100
METRIC RATING
332nd/ 347
METRIC RANK
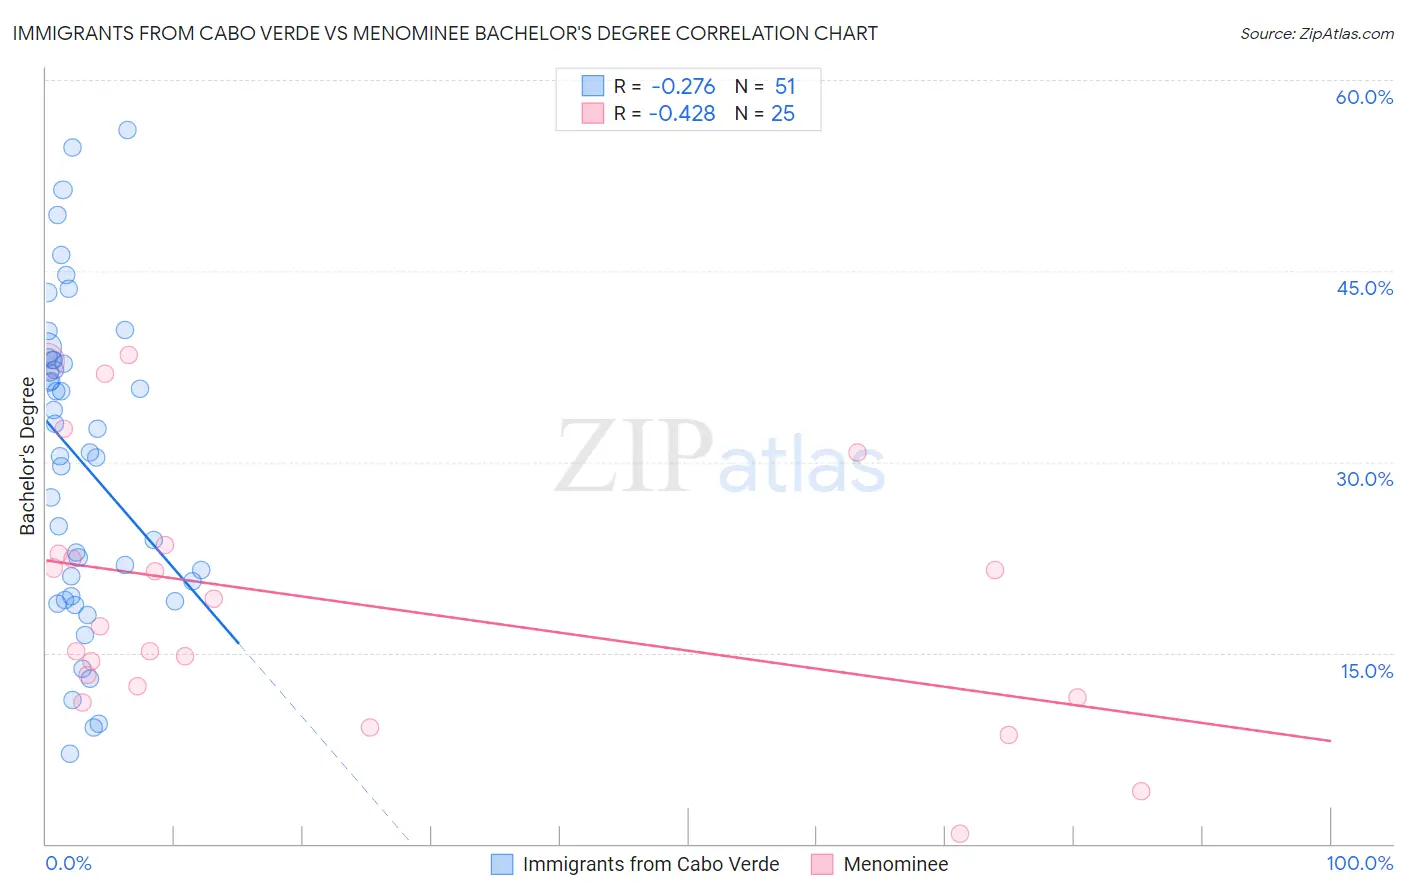
Immigrants from Cabo Verde vs Menominee Bachelor's Degree Correlation Chart
The statistical analysis conducted on geographies consisting of 38,158,316 people shows a weak negative correlation between the proportion of Immigrants from Cabo Verde and percentage of population with at least bachelor's degree education in the United States with a correlation coefficient (R) of -0.276 and weighted average of 29.2%. Similarly, the statistical analysis conducted on geographies consisting of 45,778,829 people shows a moderate negative correlation between the proportion of Menominee and percentage of population with at least bachelor's degree education in the United States with a correlation coefficient (R) of -0.428 and weighted average of 27.3%, a difference of 7.1%.
Bachelor's Degree Correlation Summary
| Measurement | Immigrants from Cabo Verde | Menominee |
| Minimum | 7.1% | 0.82% |
| Maximum | 56.1% | 38.4% |
| Range | 49.0% | 37.6% |
| Mean | 30.1% | 19.1% |
| Median | 30.8% | 17.1% |
| Interquartile 25% (IQ1) | 19.4% | 12.0% |
| Interquartile 75% (IQ3) | 38.0% | 23.1% |
| Interquartile Range (IQR) | 18.6% | 11.2% |
| Standard Deviation (Sample) | 12.3% | 10.1% |
| Standard Deviation (Population) | 12.1% | 9.9% |
Demographics Similar to Immigrants from Cabo Verde and Menominee by Bachelor's Degree
In terms of bachelor's degree, the demographic groups most similar to Immigrants from Cabo Verde are Shoshone (29.3%, a difference of 0.080%), Alaska Native (29.4%, a difference of 0.37%), Sioux (29.1%, a difference of 0.62%), Colville (29.0%, a difference of 0.83%), and Yaqui (29.0%, a difference of 0.88%). Similarly, the demographic groups most similar to Menominee are Immigrants from the Azores (27.3%, a difference of 0.10%), Spanish American Indian (27.5%, a difference of 0.58%), Immigrants from Central America (27.5%, a difference of 0.64%), Mexican (27.1%, a difference of 0.82%), and Crow (27.7%, a difference of 1.7%).
| Demographics | Rating | Rank | Bachelor's Degree |
| Alaska Natives | 0.0 /100 | #313 | Tragic 29.4% |
| Shoshone | 0.0 /100 | #314 | Tragic 29.3% |
| Immigrants | Cabo Verde | 0.0 /100 | #315 | Tragic 29.2% |
| Sioux | 0.0 /100 | #316 | Tragic 29.1% |
| Colville | 0.0 /100 | #317 | Tragic 29.0% |
| Yaqui | 0.0 /100 | #318 | Tragic 29.0% |
| Creek | 0.0 /100 | #319 | Tragic 28.9% |
| Kiowa | 0.0 /100 | #320 | Tragic 28.8% |
| Alaskan Athabascans | 0.0 /100 | #321 | Tragic 28.8% |
| Tsimshian | 0.0 /100 | #322 | Tragic 28.8% |
| Fijians | 0.0 /100 | #323 | Tragic 28.7% |
| Dutch West Indians | 0.0 /100 | #324 | Tragic 28.5% |
| Pennsylvania Germans | 0.0 /100 | #325 | Tragic 28.4% |
| Apache | 0.0 /100 | #326 | Tragic 28.3% |
| Paiute | 0.0 /100 | #327 | Tragic 28.1% |
| Crow | 0.0 /100 | #328 | Tragic 27.7% |
| Immigrants | Central America | 0.0 /100 | #329 | Tragic 27.5% |
| Spanish American Indians | 0.0 /100 | #330 | Tragic 27.5% |
| Immigrants | Azores | 0.0 /100 | #331 | Tragic 27.3% |
| Menominee | 0.0 /100 | #332 | Tragic 27.3% |
| Mexicans | 0.0 /100 | #333 | Tragic 27.1% |