Immigrants from Oceania vs Immigrants from Uganda 9th Grade
COMPARE
Immigrants from Oceania
Immigrants from Uganda
9th Grade
9th Grade Comparison
Immigrants from Oceania
Immigrants from Uganda
94.5%
9TH GRADE
12.1/ 100
METRIC RATING
213th/ 347
METRIC RANK
94.8%
9TH GRADE
43.1/ 100
METRIC RATING
180th/ 347
METRIC RANK
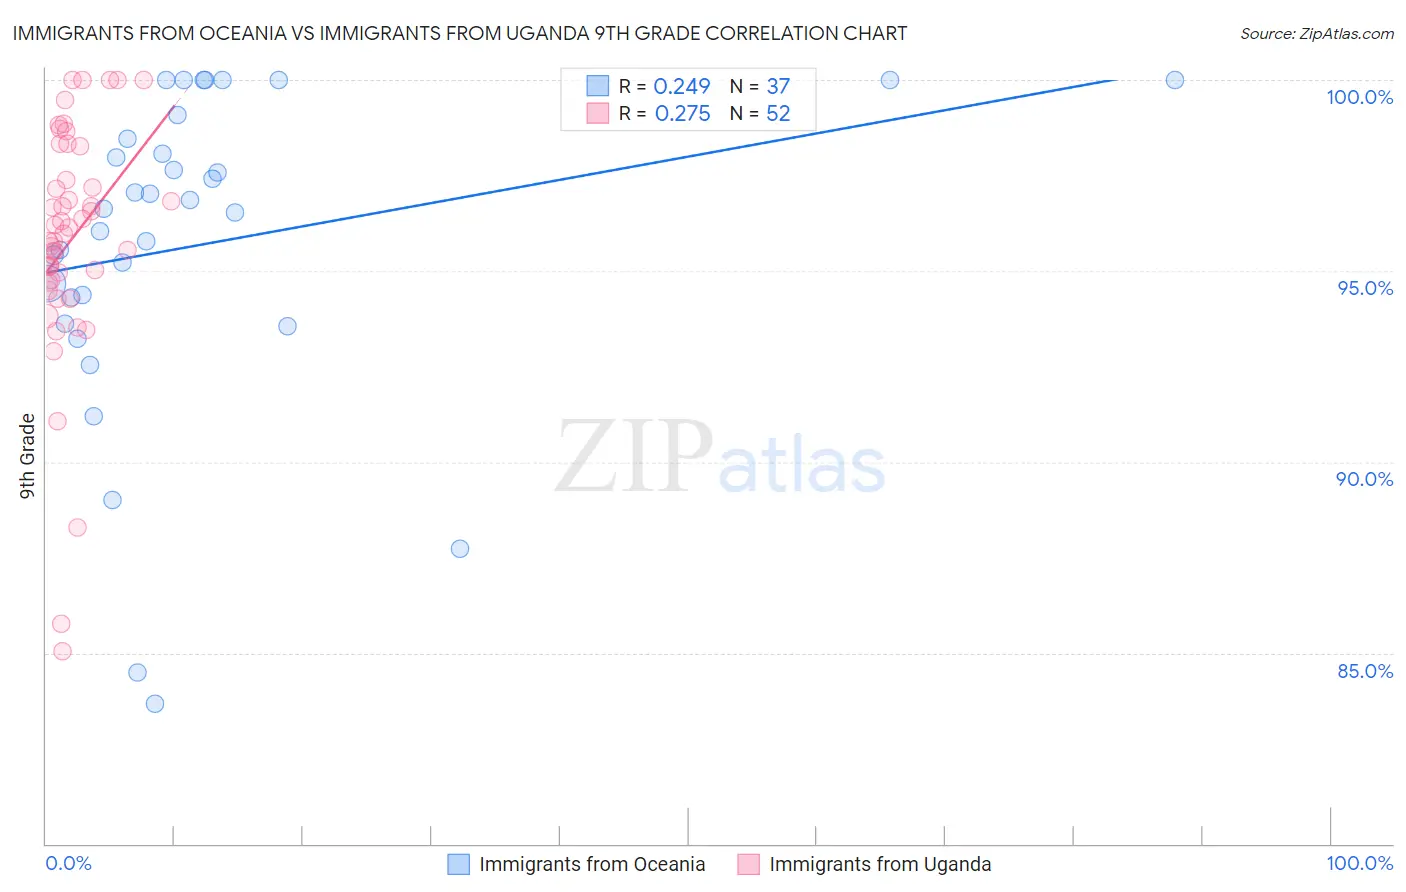
Immigrants from Oceania vs Immigrants from Uganda 9th Grade Correlation Chart
The statistical analysis conducted on geographies consisting of 305,521,521 people shows a weak positive correlation between the proportion of Immigrants from Oceania and percentage of population with at least 9th grade education in the United States with a correlation coefficient (R) of 0.249 and weighted average of 94.5%. Similarly, the statistical analysis conducted on geographies consisting of 125,943,496 people shows a weak positive correlation between the proportion of Immigrants from Uganda and percentage of population with at least 9th grade education in the United States with a correlation coefficient (R) of 0.275 and weighted average of 94.8%, a difference of 0.32%.
9th Grade Correlation Summary
| Measurement | Immigrants from Oceania | Immigrants from Uganda |
| Minimum | 83.7% | 85.0% |
| Maximum | 100.0% | 100.0% |
| Range | 16.3% | 15.0% |
| Mean | 95.7% | 95.8% |
| Median | 96.6% | 96.1% |
| Interquartile 25% (IQ1) | 94.0% | 94.7% |
| Interquartile 75% (IQ3) | 98.8% | 97.8% |
| Interquartile Range (IQR) | 4.8% | 3.1% |
| Standard Deviation (Sample) | 4.2% | 3.1% |
| Standard Deviation (Population) | 4.1% | 3.1% |
Similar Demographics by 9th Grade
Demographics Similar to Immigrants from Oceania by 9th Grade
In terms of 9th grade, the demographic groups most similar to Immigrants from Oceania are Immigrants from Indonesia (94.5%, a difference of 0.0%), Immigrants from Malaysia (94.5%, a difference of 0.0%), Immigrants from Liberia (94.5%, a difference of 0.0%), Immigrants from Chile (94.5%, a difference of 0.020%), and Immigrants from Syria (94.5%, a difference of 0.020%).
| Demographics | Rating | Rank | 9th Grade |
| Samoans | 17.3 /100 | #206 | Poor 94.6% |
| Immigrants | Morocco | 16.3 /100 | #207 | Poor 94.6% |
| Immigrants | Pakistan | 15.5 /100 | #208 | Poor 94.6% |
| Comanche | 14.9 /100 | #209 | Poor 94.6% |
| Immigrants | Chile | 13.4 /100 | #210 | Poor 94.5% |
| Immigrants | Indonesia | 12.3 /100 | #211 | Poor 94.5% |
| Immigrants | Malaysia | 12.2 /100 | #212 | Poor 94.5% |
| Immigrants | Oceania | 12.1 /100 | #213 | Poor 94.5% |
| Immigrants | Liberia | 11.8 /100 | #214 | Poor 94.5% |
| Immigrants | Syria | 11.0 /100 | #215 | Poor 94.5% |
| Immigrants | Western Asia | 10.7 /100 | #216 | Poor 94.5% |
| Asians | 9.9 /100 | #217 | Tragic 94.5% |
| Portuguese | 9.2 /100 | #218 | Tragic 94.5% |
| Africans | 9.0 /100 | #219 | Tragic 94.5% |
| Indians (Asian) | 8.6 /100 | #220 | Tragic 94.5% |
Demographics Similar to Immigrants from Uganda by 9th Grade
In terms of 9th grade, the demographic groups most similar to Immigrants from Uganda are Sierra Leonean (94.8%, a difference of 0.0%), Seminole (94.8%, a difference of 0.0%), Immigrants from Venezuela (94.9%, a difference of 0.020%), Immigrants from Iraq (94.9%, a difference of 0.030%), and Immigrants from Poland (94.9%, a difference of 0.030%).
| Demographics | Rating | Rank | 9th Grade |
| Cheyenne | 51.5 /100 | #173 | Average 94.9% |
| Immigrants | Egypt | 50.0 /100 | #174 | Average 94.9% |
| Brazilians | 49.8 /100 | #175 | Average 94.9% |
| Immigrants | Spain | 49.1 /100 | #176 | Average 94.9% |
| Immigrants | Iraq | 47.8 /100 | #177 | Average 94.9% |
| Immigrants | Poland | 46.7 /100 | #178 | Average 94.9% |
| Immigrants | Venezuela | 46.5 /100 | #179 | Average 94.9% |
| Immigrants | Uganda | 43.1 /100 | #180 | Average 94.8% |
| Sierra Leoneans | 42.7 /100 | #181 | Average 94.8% |
| Seminole | 42.5 /100 | #182 | Average 94.8% |
| Immigrants | Nepal | 39.7 /100 | #183 | Fair 94.8% |
| Argentineans | 37.6 /100 | #184 | Fair 94.8% |
| Liberians | 37.4 /100 | #185 | Fair 94.8% |
| Hopi | 37.1 /100 | #186 | Fair 94.8% |
| Guamanians/Chamorros | 35.5 /100 | #187 | Fair 94.8% |