Alaska Native vs Immigrants from Uganda 9th Grade
COMPARE
Alaska Native
Immigrants from Uganda
9th Grade
9th Grade Comparison
Alaska Natives
Immigrants from Uganda
96.1%
9TH GRADE
99.9/ 100
METRIC RATING
44th/ 347
METRIC RANK
94.8%
9TH GRADE
43.1/ 100
METRIC RATING
180th/ 347
METRIC RANK
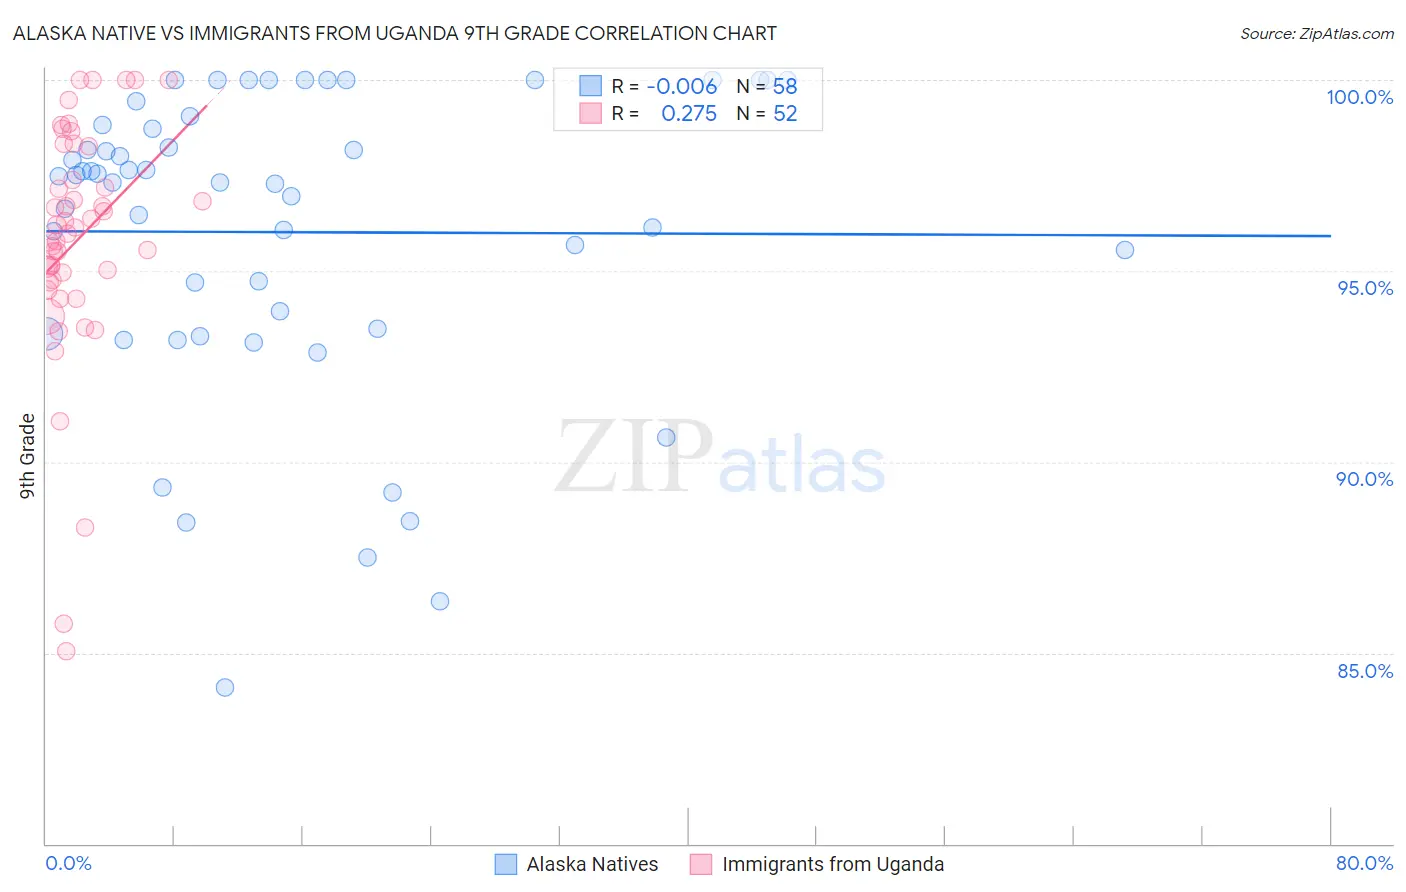
Alaska Native vs Immigrants from Uganda 9th Grade Correlation Chart
The statistical analysis conducted on geographies consisting of 76,778,057 people shows no correlation between the proportion of Alaska Natives and percentage of population with at least 9th grade education in the United States with a correlation coefficient (R) of -0.006 and weighted average of 96.1%. Similarly, the statistical analysis conducted on geographies consisting of 125,943,496 people shows a weak positive correlation between the proportion of Immigrants from Uganda and percentage of population with at least 9th grade education in the United States with a correlation coefficient (R) of 0.275 and weighted average of 94.8%, a difference of 1.3%.
9th Grade Correlation Summary
| Measurement | Alaska Native | Immigrants from Uganda |
| Minimum | 84.1% | 85.0% |
| Maximum | 100.0% | 100.0% |
| Range | 15.9% | 15.0% |
| Mean | 96.0% | 95.8% |
| Median | 97.4% | 96.1% |
| Interquartile 25% (IQ1) | 93.5% | 94.7% |
| Interquartile 75% (IQ3) | 98.8% | 97.8% |
| Interquartile Range (IQR) | 5.3% | 3.1% |
| Standard Deviation (Sample) | 3.9% | 3.1% |
| Standard Deviation (Population) | 3.9% | 3.1% |
Similar Demographics by 9th Grade
Demographics Similar to Alaska Natives by 9th Grade
In terms of 9th grade, the demographic groups most similar to Alaska Natives are Crow (96.1%, a difference of 0.010%), Immigrants from India (96.1%, a difference of 0.010%), Iranian (96.1%, a difference of 0.020%), Russian (96.0%, a difference of 0.020%), and Australian (96.0%, a difference of 0.020%).
| Demographics | Rating | Rank | 9th Grade |
| Estonians | 99.9 /100 | #37 | Exceptional 96.1% |
| Immigrants | Scotland | 99.9 /100 | #38 | Exceptional 96.1% |
| Ottawa | 99.9 /100 | #39 | Exceptional 96.1% |
| Slavs | 99.9 /100 | #40 | Exceptional 96.1% |
| Czechoslovakians | 99.9 /100 | #41 | Exceptional 96.1% |
| Chippewa | 99.9 /100 | #42 | Exceptional 96.1% |
| Iranians | 99.9 /100 | #43 | Exceptional 96.1% |
| Alaska Natives | 99.9 /100 | #44 | Exceptional 96.1% |
| Crow | 99.9 /100 | #45 | Exceptional 96.1% |
| Immigrants | India | 99.9 /100 | #46 | Exceptional 96.1% |
| Russians | 99.9 /100 | #47 | Exceptional 96.0% |
| Australians | 99.9 /100 | #48 | Exceptional 96.0% |
| Greeks | 99.9 /100 | #49 | Exceptional 96.0% |
| Celtics | 99.9 /100 | #50 | Exceptional 96.0% |
| Immigrants | Northern Europe | 99.9 /100 | #51 | Exceptional 96.0% |
Demographics Similar to Immigrants from Uganda by 9th Grade
In terms of 9th grade, the demographic groups most similar to Immigrants from Uganda are Sierra Leonean (94.8%, a difference of 0.0%), Seminole (94.8%, a difference of 0.0%), Immigrants from Venezuela (94.9%, a difference of 0.020%), Immigrants from Iraq (94.9%, a difference of 0.030%), and Immigrants from Poland (94.9%, a difference of 0.030%).
| Demographics | Rating | Rank | 9th Grade |
| Cheyenne | 51.5 /100 | #173 | Average 94.9% |
| Immigrants | Egypt | 50.0 /100 | #174 | Average 94.9% |
| Brazilians | 49.8 /100 | #175 | Average 94.9% |
| Immigrants | Spain | 49.1 /100 | #176 | Average 94.9% |
| Immigrants | Iraq | 47.8 /100 | #177 | Average 94.9% |
| Immigrants | Poland | 46.7 /100 | #178 | Average 94.9% |
| Immigrants | Venezuela | 46.5 /100 | #179 | Average 94.9% |
| Immigrants | Uganda | 43.1 /100 | #180 | Average 94.8% |
| Sierra Leoneans | 42.7 /100 | #181 | Average 94.8% |
| Seminole | 42.5 /100 | #182 | Average 94.8% |
| Immigrants | Nepal | 39.7 /100 | #183 | Fair 94.8% |
| Argentineans | 37.6 /100 | #184 | Fair 94.8% |
| Liberians | 37.4 /100 | #185 | Fair 94.8% |
| Hopi | 37.1 /100 | #186 | Fair 94.8% |
| Guamanians/Chamorros | 35.5 /100 | #187 | Fair 94.8% |