Cypriot vs Immigrants from Uganda 9th Grade
COMPARE
Cypriot
Immigrants from Uganda
9th Grade
9th Grade Comparison
Cypriots
Immigrants from Uganda
95.8%
9TH GRADE
99.6/ 100
METRIC RATING
67th/ 347
METRIC RANK
94.8%
9TH GRADE
43.1/ 100
METRIC RATING
180th/ 347
METRIC RANK
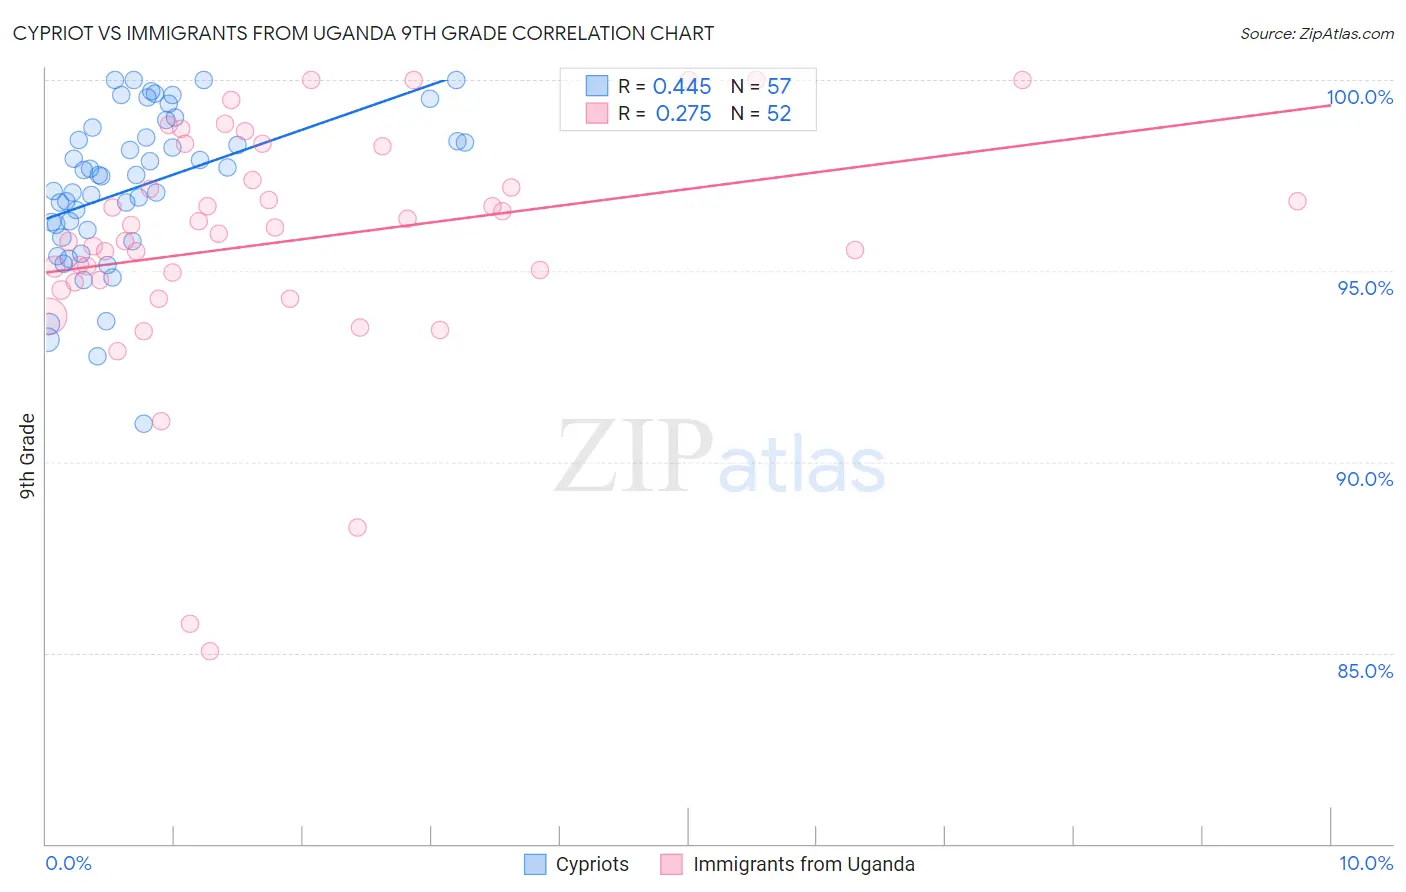
Cypriot vs Immigrants from Uganda 9th Grade Correlation Chart
The statistical analysis conducted on geographies consisting of 61,870,289 people shows a moderate positive correlation between the proportion of Cypriots and percentage of population with at least 9th grade education in the United States with a correlation coefficient (R) of 0.445 and weighted average of 95.8%. Similarly, the statistical analysis conducted on geographies consisting of 125,943,496 people shows a weak positive correlation between the proportion of Immigrants from Uganda and percentage of population with at least 9th grade education in the United States with a correlation coefficient (R) of 0.275 and weighted average of 94.8%, a difference of 1.1%.
9th Grade Correlation Summary
| Measurement | Cypriot | Immigrants from Uganda |
| Minimum | 91.0% | 85.0% |
| Maximum | 100.0% | 100.0% |
| Range | 9.0% | 15.0% |
| Mean | 97.2% | 95.8% |
| Median | 97.5% | 96.1% |
| Interquartile 25% (IQ1) | 96.0% | 94.7% |
| Interquartile 75% (IQ3) | 98.6% | 97.8% |
| Interquartile Range (IQR) | 2.6% | 3.1% |
| Standard Deviation (Sample) | 2.0% | 3.1% |
| Standard Deviation (Population) | 2.0% | 3.1% |
Similar Demographics by 9th Grade
Demographics Similar to Cypriots by 9th Grade
In terms of 9th grade, the demographic groups most similar to Cypriots are Immigrants from Ireland (95.8%, a difference of 0.0%), Immigrants from Lithuania (95.8%, a difference of 0.0%), Immigrants from Netherlands (95.8%, a difference of 0.010%), Immigrants from England (95.9%, a difference of 0.020%), and Immigrants from Australia (95.8%, a difference of 0.020%).
| Demographics | Rating | Rank | 9th Grade |
| Native Hawaiians | 99.8 /100 | #60 | Exceptional 95.9% |
| Sioux | 99.8 /100 | #61 | Exceptional 95.9% |
| Ukrainians | 99.7 /100 | #62 | Exceptional 95.9% |
| Canadians | 99.7 /100 | #63 | Exceptional 95.9% |
| Zimbabweans | 99.7 /100 | #64 | Exceptional 95.9% |
| Immigrants | England | 99.6 /100 | #65 | Exceptional 95.9% |
| Immigrants | Netherlands | 99.6 /100 | #66 | Exceptional 95.8% |
| Cypriots | 99.6 /100 | #67 | Exceptional 95.8% |
| Immigrants | Ireland | 99.6 /100 | #68 | Exceptional 95.8% |
| Immigrants | Lithuania | 99.6 /100 | #69 | Exceptional 95.8% |
| Immigrants | Australia | 99.5 /100 | #70 | Exceptional 95.8% |
| Immigrants | Belgium | 99.5 /100 | #71 | Exceptional 95.8% |
| Turks | 99.5 /100 | #72 | Exceptional 95.8% |
| Immigrants | Singapore | 99.5 /100 | #73 | Exceptional 95.8% |
| Thais | 99.5 /100 | #74 | Exceptional 95.8% |
Demographics Similar to Immigrants from Uganda by 9th Grade
In terms of 9th grade, the demographic groups most similar to Immigrants from Uganda are Sierra Leonean (94.8%, a difference of 0.0%), Seminole (94.8%, a difference of 0.0%), Immigrants from Venezuela (94.9%, a difference of 0.020%), Immigrants from Iraq (94.9%, a difference of 0.030%), and Immigrants from Poland (94.9%, a difference of 0.030%).
| Demographics | Rating | Rank | 9th Grade |
| Cheyenne | 51.5 /100 | #173 | Average 94.9% |
| Immigrants | Egypt | 50.0 /100 | #174 | Average 94.9% |
| Brazilians | 49.8 /100 | #175 | Average 94.9% |
| Immigrants | Spain | 49.1 /100 | #176 | Average 94.9% |
| Immigrants | Iraq | 47.8 /100 | #177 | Average 94.9% |
| Immigrants | Poland | 46.7 /100 | #178 | Average 94.9% |
| Immigrants | Venezuela | 46.5 /100 | #179 | Average 94.9% |
| Immigrants | Uganda | 43.1 /100 | #180 | Average 94.8% |
| Sierra Leoneans | 42.7 /100 | #181 | Average 94.8% |
| Seminole | 42.5 /100 | #182 | Average 94.8% |
| Immigrants | Nepal | 39.7 /100 | #183 | Fair 94.8% |
| Argentineans | 37.6 /100 | #184 | Fair 94.8% |
| Liberians | 37.4 /100 | #185 | Fair 94.8% |
| Hopi | 37.1 /100 | #186 | Fair 94.8% |
| Guamanians/Chamorros | 35.5 /100 | #187 | Fair 94.8% |