Immigrants from Burma/Myanmar vs Immigrants from Philippines Nursery School
COMPARE
Immigrants from Burma/Myanmar
Immigrants from Philippines
Nursery School
Nursery School Comparison
Immigrants from Burma/Myanmar
Immigrants from Philippines
96.9%
NURSERY SCHOOL
0.0/ 100
METRIC RATING
320th/ 347
METRIC RANK
97.5%
NURSERY SCHOOL
0.1/ 100
METRIC RATING
276th/ 347
METRIC RANK
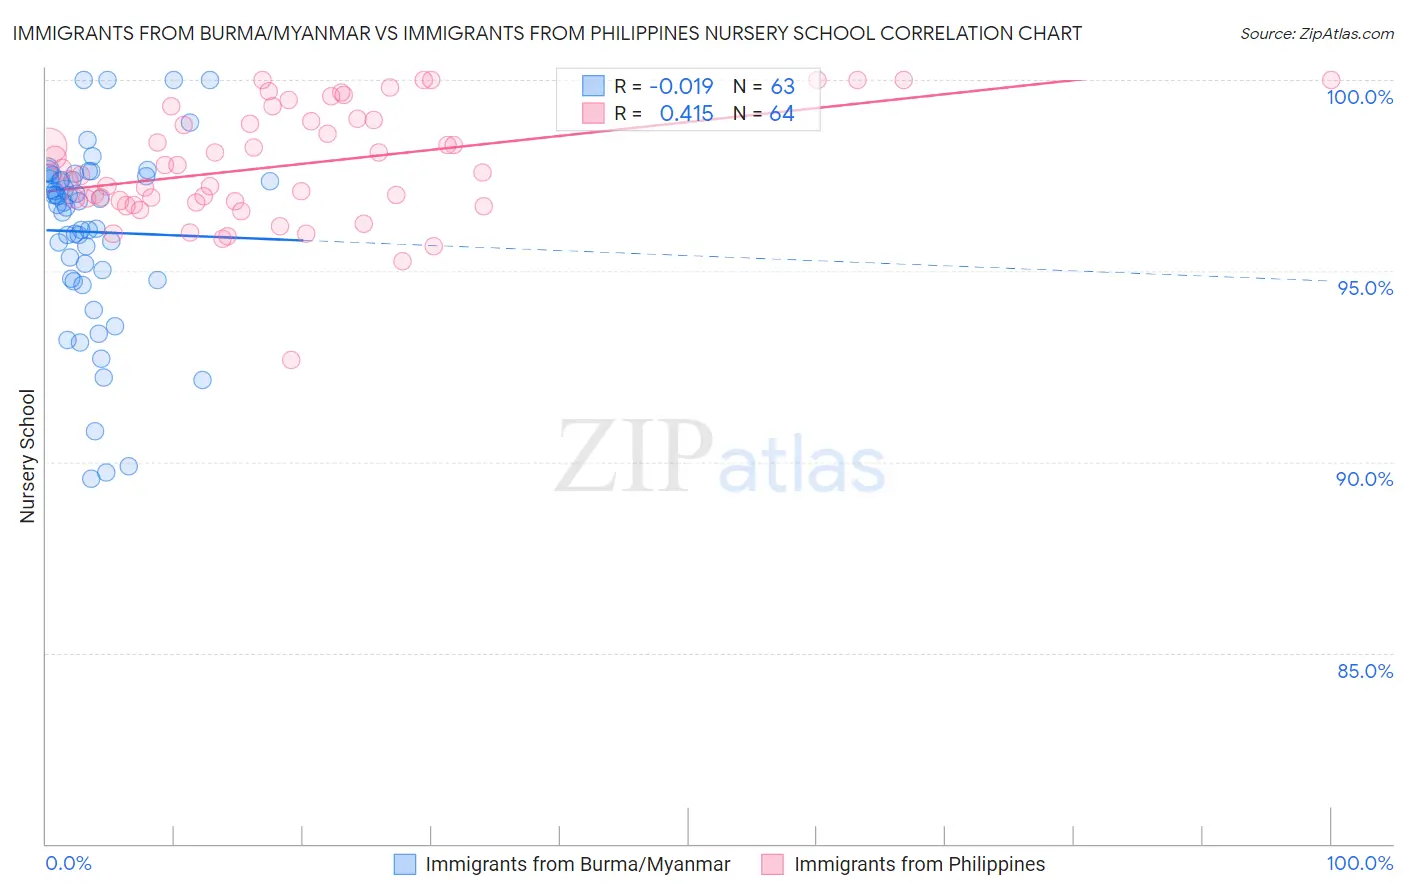
Immigrants from Burma/Myanmar vs Immigrants from Philippines Nursery School Correlation Chart
The statistical analysis conducted on geographies consisting of 172,338,093 people shows no correlation between the proportion of Immigrants from Burma/Myanmar and percentage of population with at least nursery school education in the United States with a correlation coefficient (R) of -0.019 and weighted average of 96.9%. Similarly, the statistical analysis conducted on geographies consisting of 471,303,140 people shows a moderate positive correlation between the proportion of Immigrants from Philippines and percentage of population with at least nursery school education in the United States with a correlation coefficient (R) of 0.415 and weighted average of 97.5%, a difference of 0.60%.
Nursery School Correlation Summary
| Measurement | Immigrants from Burma/Myanmar | Immigrants from Philippines |
| Minimum | 89.6% | 92.7% |
| Maximum | 100.0% | 100.0% |
| Range | 10.4% | 7.3% |
| Mean | 96.0% | 97.8% |
| Median | 96.8% | 97.6% |
| Interquartile 25% (IQ1) | 94.8% | 96.8% |
| Interquartile 75% (IQ3) | 97.5% | 99.0% |
| Interquartile Range (IQR) | 2.7% | 2.2% |
| Standard Deviation (Sample) | 2.4% | 1.5% |
| Standard Deviation (Population) | 2.4% | 1.5% |
Similar Demographics by Nursery School
Demographics Similar to Immigrants from Burma/Myanmar by Nursery School
In terms of nursery school, the demographic groups most similar to Immigrants from Burma/Myanmar are Immigrants from Laos (96.9%, a difference of 0.0%), Immigrants from Bangladesh (96.9%, a difference of 0.0%), Immigrants from Guyana (96.9%, a difference of 0.020%), Mexican American Indian (96.9%, a difference of 0.020%), and Immigrants from Honduras (96.9%, a difference of 0.030%).
| Demographics | Rating | Rank | Nursery School |
| Hondurans | 0.0 /100 | #313 | Tragic 97.0% |
| Cape Verdeans | 0.0 /100 | #314 | Tragic 97.0% |
| Immigrants | Nicaragua | 0.0 /100 | #315 | Tragic 96.9% |
| Immigrants | Belize | 0.0 /100 | #316 | Tragic 96.9% |
| Immigrants | Ecuador | 0.0 /100 | #317 | Tragic 96.9% |
| Immigrants | Guyana | 0.0 /100 | #318 | Tragic 96.9% |
| Immigrants | Laos | 0.0 /100 | #319 | Tragic 96.9% |
| Immigrants | Burma/Myanmar | 0.0 /100 | #320 | Tragic 96.9% |
| Immigrants | Bangladesh | 0.0 /100 | #321 | Tragic 96.9% |
| Mexican American Indians | 0.0 /100 | #322 | Tragic 96.9% |
| Immigrants | Honduras | 0.0 /100 | #323 | Tragic 96.9% |
| Vietnamese | 0.0 /100 | #324 | Tragic 96.8% |
| Dominicans | 0.0 /100 | #325 | Tragic 96.8% |
| Indonesians | 0.0 /100 | #326 | Tragic 96.8% |
| Mexicans | 0.0 /100 | #327 | Tragic 96.8% |
Demographics Similar to Immigrants from Philippines by Nursery School
In terms of nursery school, the demographic groups most similar to Immigrants from Philippines are Immigrants from Western Africa (97.4%, a difference of 0.010%), Immigrants from China (97.5%, a difference of 0.020%), Immigrants from Cameroon (97.5%, a difference of 0.020%), Ghanaian (97.5%, a difference of 0.020%), and Immigrants from Uzbekistan (97.4%, a difference of 0.030%).
| Demographics | Rating | Rank | Nursery School |
| Immigrants | Liberia | 0.3 /100 | #269 | Tragic 97.5% |
| Immigrants | Jamaica | 0.2 /100 | #270 | Tragic 97.5% |
| Immigrants | Peru | 0.2 /100 | #271 | Tragic 97.5% |
| Immigrants | Bolivia | 0.1 /100 | #272 | Tragic 97.5% |
| Immigrants | China | 0.1 /100 | #273 | Tragic 97.5% |
| Immigrants | Cameroon | 0.1 /100 | #274 | Tragic 97.5% |
| Ghanaians | 0.1 /100 | #275 | Tragic 97.5% |
| Immigrants | Philippines | 0.1 /100 | #276 | Tragic 97.5% |
| Immigrants | Western Africa | 0.1 /100 | #277 | Tragic 97.4% |
| Immigrants | Uzbekistan | 0.1 /100 | #278 | Tragic 97.4% |
| Immigrants | Ghana | 0.1 /100 | #279 | Tragic 97.4% |
| Barbadians | 0.0 /100 | #280 | Tragic 97.4% |
| Trinidadians and Tobagonians | 0.0 /100 | #281 | Tragic 97.4% |
| Afghans | 0.0 /100 | #282 | Tragic 97.4% |
| Immigrants | West Indies | 0.0 /100 | #283 | Tragic 97.4% |