Immigrants from Burma/Myanmar vs Paiute Nursery School
COMPARE
Immigrants from Burma/Myanmar
Paiute
Nursery School
Nursery School Comparison
Immigrants from Burma/Myanmar
Paiute
96.9%
NURSERY SCHOOL
0.0/ 100
METRIC RATING
320th/ 347
METRIC RANK
98.0%
NURSERY SCHOOL
42.0/ 100
METRIC RATING
182nd/ 347
METRIC RANK
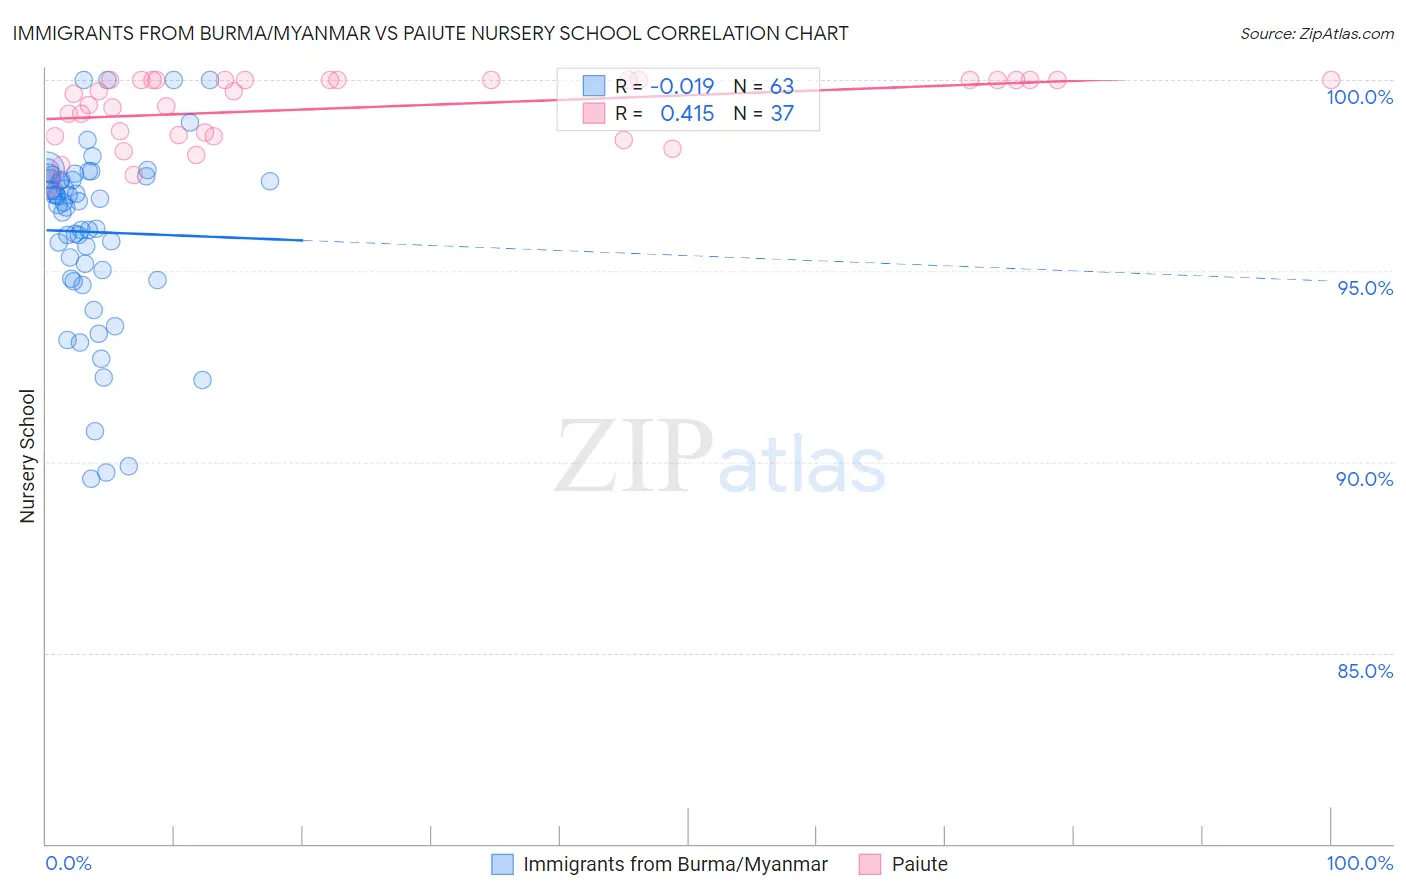
Immigrants from Burma/Myanmar vs Paiute Nursery School Correlation Chart
The statistical analysis conducted on geographies consisting of 172,338,093 people shows no correlation between the proportion of Immigrants from Burma/Myanmar and percentage of population with at least nursery school education in the United States with a correlation coefficient (R) of -0.019 and weighted average of 96.9%. Similarly, the statistical analysis conducted on geographies consisting of 58,402,332 people shows a moderate positive correlation between the proportion of Paiute and percentage of population with at least nursery school education in the United States with a correlation coefficient (R) of 0.415 and weighted average of 98.0%, a difference of 1.1%.
Nursery School Correlation Summary
| Measurement | Immigrants from Burma/Myanmar | Paiute |
| Minimum | 89.6% | 97.3% |
| Maximum | 100.0% | 100.0% |
| Range | 10.4% | 2.7% |
| Mean | 96.0% | 99.3% |
| Median | 96.8% | 99.7% |
| Interquartile 25% (IQ1) | 94.8% | 98.5% |
| Interquartile 75% (IQ3) | 97.5% | 100.0% |
| Interquartile Range (IQR) | 2.7% | 1.5% |
| Standard Deviation (Sample) | 2.4% | 0.85% |
| Standard Deviation (Population) | 2.4% | 0.84% |
Similar Demographics by Nursery School
Demographics Similar to Immigrants from Burma/Myanmar by Nursery School
In terms of nursery school, the demographic groups most similar to Immigrants from Burma/Myanmar are Immigrants from Laos (96.9%, a difference of 0.0%), Immigrants from Bangladesh (96.9%, a difference of 0.0%), Immigrants from Guyana (96.9%, a difference of 0.020%), Mexican American Indian (96.9%, a difference of 0.020%), and Immigrants from Honduras (96.9%, a difference of 0.030%).
| Demographics | Rating | Rank | Nursery School |
| Hondurans | 0.0 /100 | #313 | Tragic 97.0% |
| Cape Verdeans | 0.0 /100 | #314 | Tragic 97.0% |
| Immigrants | Nicaragua | 0.0 /100 | #315 | Tragic 96.9% |
| Immigrants | Belize | 0.0 /100 | #316 | Tragic 96.9% |
| Immigrants | Ecuador | 0.0 /100 | #317 | Tragic 96.9% |
| Immigrants | Guyana | 0.0 /100 | #318 | Tragic 96.9% |
| Immigrants | Laos | 0.0 /100 | #319 | Tragic 96.9% |
| Immigrants | Burma/Myanmar | 0.0 /100 | #320 | Tragic 96.9% |
| Immigrants | Bangladesh | 0.0 /100 | #321 | Tragic 96.9% |
| Mexican American Indians | 0.0 /100 | #322 | Tragic 96.9% |
| Immigrants | Honduras | 0.0 /100 | #323 | Tragic 96.9% |
| Vietnamese | 0.0 /100 | #324 | Tragic 96.8% |
| Dominicans | 0.0 /100 | #325 | Tragic 96.8% |
| Indonesians | 0.0 /100 | #326 | Tragic 96.8% |
| Mexicans | 0.0 /100 | #327 | Tragic 96.8% |
Demographics Similar to Paiute by Nursery School
In terms of nursery school, the demographic groups most similar to Paiute are Egyptian (98.0%, a difference of 0.0%), Portuguese (98.0%, a difference of 0.0%), Immigrants from Poland (98.0%, a difference of 0.0%), Immigrants from Belarus (98.0%, a difference of 0.0%), and Immigrants from Argentina (98.0%, a difference of 0.0%).
| Demographics | Rating | Rank | Nursery School |
| Immigrants | Sri Lanka | 49.9 /100 | #175 | Average 98.0% |
| Immigrants | Venezuela | 49.8 /100 | #176 | Average 98.0% |
| Albanians | 48.9 /100 | #177 | Average 98.0% |
| Natives/Alaskans | 48.6 /100 | #178 | Average 98.0% |
| Argentineans | 46.8 /100 | #179 | Average 98.0% |
| Immigrants | Bosnia and Herzegovina | 45.6 /100 | #180 | Average 98.0% |
| Egyptians | 42.8 /100 | #181 | Average 98.0% |
| Paiute | 42.0 /100 | #182 | Average 98.0% |
| Portuguese | 41.8 /100 | #183 | Average 98.0% |
| Immigrants | Poland | 41.3 /100 | #184 | Average 98.0% |
| Immigrants | Belarus | 41.0 /100 | #185 | Average 98.0% |
| Immigrants | Argentina | 40.8 /100 | #186 | Average 98.0% |
| Immigrants | Kazakhstan | 37.1 /100 | #187 | Fair 97.9% |
| Arabs | 34.7 /100 | #188 | Fair 97.9% |
| Pakistanis | 34.6 /100 | #189 | Fair 97.9% |