Filipino vs Alsatian No Schooling Completed
COMPARE
Filipino
Alsatian
No Schooling Completed
No Schooling Completed Comparison
Filipinos
Alsatians
2.0%
NO SCHOOLING COMPLETED
85.5/ 100
METRIC RATING
137th/ 347
METRIC RANK
2.0%
NO SCHOOLING COMPLETED
79.1/ 100
METRIC RATING
144th/ 347
METRIC RANK
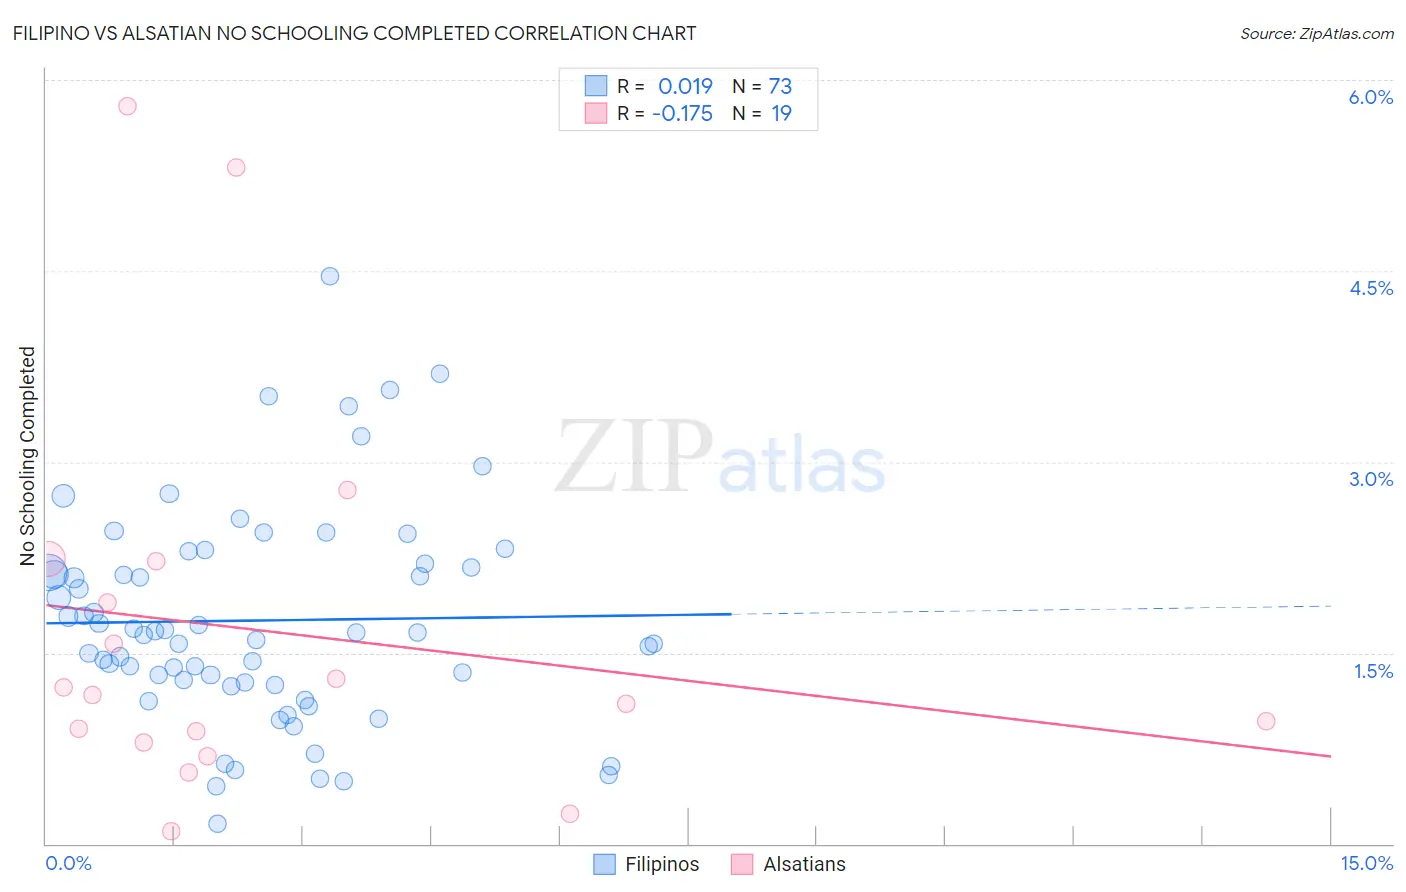
Filipino vs Alsatian No Schooling Completed Correlation Chart
The statistical analysis conducted on geographies consisting of 252,358,967 people shows no correlation between the proportion of Filipinos and percentage of population with no schooling in the United States with a correlation coefficient (R) of 0.019 and weighted average of 2.0%. Similarly, the statistical analysis conducted on geographies consisting of 82,371,288 people shows a poor negative correlation between the proportion of Alsatians and percentage of population with no schooling in the United States with a correlation coefficient (R) of -0.175 and weighted average of 2.0%, a difference of 1.6%.
No Schooling Completed Correlation Summary
| Measurement | Filipino | Alsatian |
| Minimum | 0.16% | 0.10% |
| Maximum | 4.5% | 5.8% |
| Range | 4.3% | 5.7% |
| Mean | 1.8% | 1.7% |
| Median | 1.7% | 1.2% |
| Interquartile 25% (IQ1) | 1.3% | 0.80% |
| Interquartile 75% (IQ3) | 2.2% | 2.2% |
| Interquartile Range (IQR) | 0.92% | 1.4% |
| Standard Deviation (Sample) | 0.84% | 1.5% |
| Standard Deviation (Population) | 0.83% | 1.5% |
Demographics Similar to Filipinos and Alsatians by No Schooling Completed
In terms of no schooling completed, the demographic groups most similar to Filipinos are Immigrants from Israel (2.0%, a difference of 0.030%), Jordanian (2.0%, a difference of 0.29%), Marshallese (2.0%, a difference of 0.55%), Immigrants from Greece (2.0%, a difference of 0.56%), and Burmese (1.9%, a difference of 0.86%). Similarly, the demographic groups most similar to Alsatians are Immigrants from Iran (2.0%, a difference of 0.010%), Immigrants from South Central Asia (2.0%, a difference of 0.20%), Immigrants from Moldova (2.0%, a difference of 0.22%), Soviet Union (2.0%, a difference of 0.40%), and Shoshone (2.0%, a difference of 0.48%).
| Demographics | Rating | Rank | No Schooling Completed |
| Palestinians | 91.8 /100 | #130 | Exceptional 1.9% |
| Immigrants | Hungary | 91.6 /100 | #131 | Exceptional 1.9% |
| Colville | 90.4 /100 | #132 | Exceptional 1.9% |
| Immigrants | Turkey | 90.2 /100 | #133 | Exceptional 1.9% |
| Menominee | 89.6 /100 | #134 | Excellent 1.9% |
| Hmong | 88.5 /100 | #135 | Excellent 1.9% |
| Burmese | 88.2 /100 | #136 | Excellent 1.9% |
| Filipinos | 85.5 /100 | #137 | Excellent 2.0% |
| Immigrants | Israel | 85.4 /100 | #138 | Excellent 2.0% |
| Jordanians | 84.5 /100 | #139 | Excellent 2.0% |
| Marshallese | 83.5 /100 | #140 | Excellent 2.0% |
| Immigrants | Greece | 83.5 /100 | #141 | Excellent 2.0% |
| Venezuelans | 81.5 /100 | #142 | Excellent 2.0% |
| Immigrants | South Central Asia | 80.0 /100 | #143 | Good 2.0% |
| Alsatians | 79.1 /100 | #144 | Good 2.0% |
| Immigrants | Iran | 79.0 /100 | #145 | Good 2.0% |
| Immigrants | Moldova | 78.0 /100 | #146 | Good 2.0% |
| Soviet Union | 77.1 /100 | #147 | Good 2.0% |
| Shoshone | 76.7 /100 | #148 | Good 2.0% |
| Immigrants | North Macedonia | 75.9 /100 | #149 | Good 2.0% |
| Blackfeet | 72.9 /100 | #150 | Good 2.0% |