Yuman vs Alsatian No Schooling Completed
COMPARE
Yuman
Alsatian
No Schooling Completed
No Schooling Completed Comparison
Yuman
Alsatians
2.5%
NO SCHOOLING COMPLETED
0.4/ 100
METRIC RATING
267th/ 347
METRIC RANK
2.0%
NO SCHOOLING COMPLETED
79.1/ 100
METRIC RATING
144th/ 347
METRIC RANK
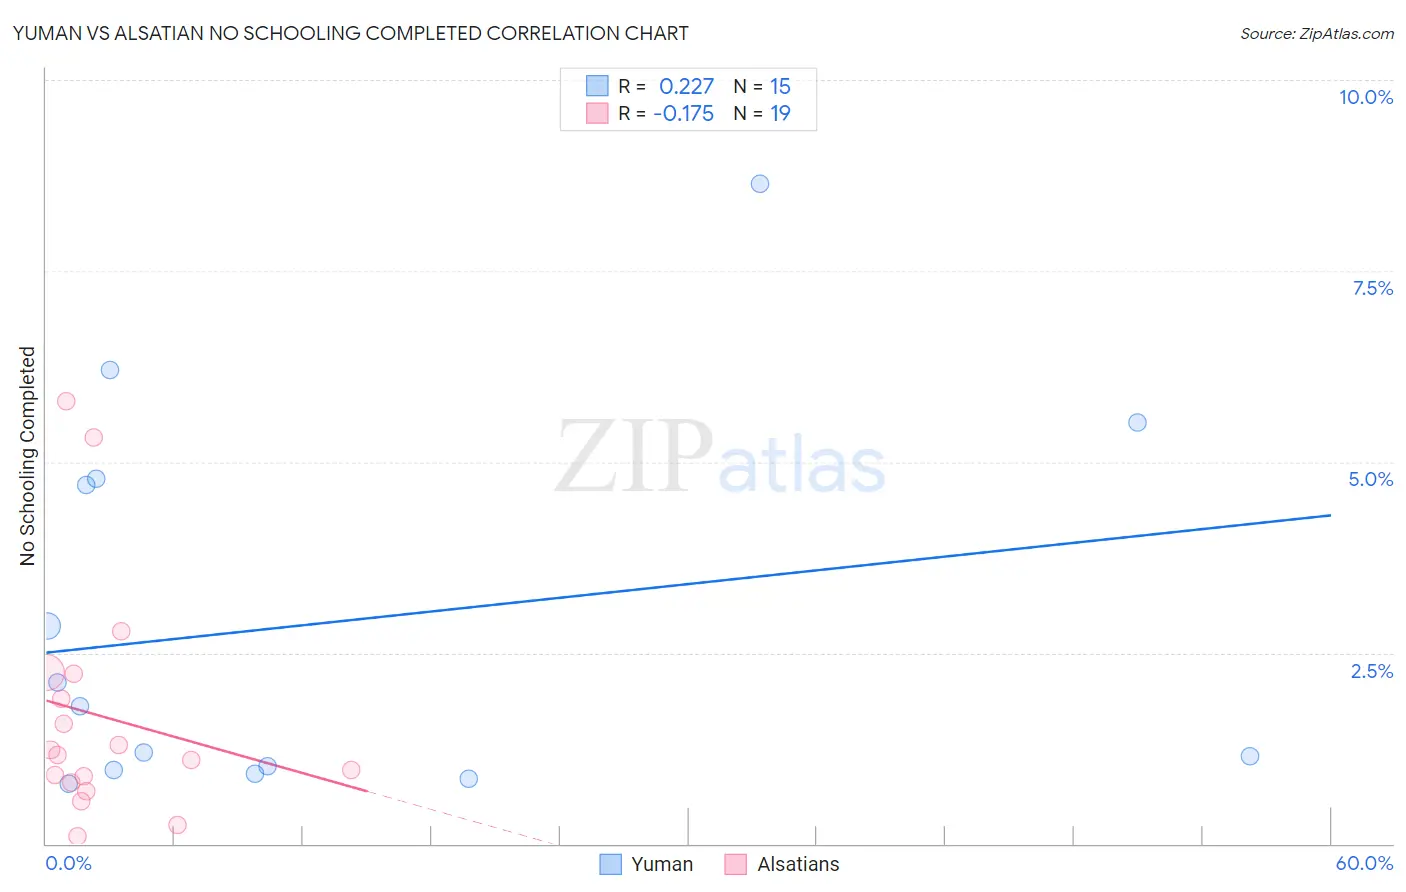
Yuman vs Alsatian No Schooling Completed Correlation Chart
The statistical analysis conducted on geographies consisting of 40,618,798 people shows a weak positive correlation between the proportion of Yuman and percentage of population with no schooling in the United States with a correlation coefficient (R) of 0.227 and weighted average of 2.5%. Similarly, the statistical analysis conducted on geographies consisting of 82,371,288 people shows a poor negative correlation between the proportion of Alsatians and percentage of population with no schooling in the United States with a correlation coefficient (R) of -0.175 and weighted average of 2.0%, a difference of 24.4%.
No Schooling Completed Correlation Summary
| Measurement | Yuman | Alsatian |
| Minimum | 0.78% | 0.10% |
| Maximum | 8.6% | 5.8% |
| Range | 7.9% | 5.7% |
| Mean | 2.9% | 1.7% |
| Median | 1.8% | 1.2% |
| Interquartile 25% (IQ1) | 0.96% | 0.80% |
| Interquartile 75% (IQ3) | 4.8% | 2.2% |
| Interquartile Range (IQR) | 3.8% | 1.4% |
| Standard Deviation (Sample) | 2.5% | 1.5% |
| Standard Deviation (Population) | 2.4% | 1.5% |
Similar Demographics by No Schooling Completed
Demographics Similar to Yuman by No Schooling Completed
In terms of no schooling completed, the demographic groups most similar to Yuman are Fijian (2.5%, a difference of 0.17%), West Indian (2.5%, a difference of 0.25%), Taiwanese (2.5%, a difference of 0.26%), Indian (Asian) (2.5%, a difference of 0.43%), and Immigrants from Liberia (2.5%, a difference of 0.56%).
| Demographics | Rating | Rank | No Schooling Completed |
| Immigrants | Ethiopia | 0.6 /100 | #260 | Tragic 2.5% |
| Armenians | 0.5 /100 | #261 | Tragic 2.5% |
| Immigrants | Sierra Leone | 0.5 /100 | #262 | Tragic 2.5% |
| Immigrants | Liberia | 0.4 /100 | #263 | Tragic 2.5% |
| Indians (Asian) | 0.4 /100 | #264 | Tragic 2.5% |
| West Indians | 0.4 /100 | #265 | Tragic 2.5% |
| Fijians | 0.4 /100 | #266 | Tragic 2.5% |
| Yuman | 0.4 /100 | #267 | Tragic 2.5% |
| Taiwanese | 0.3 /100 | #268 | Tragic 2.5% |
| Immigrants | Nigeria | 0.2 /100 | #269 | Tragic 2.5% |
| Immigrants | Peru | 0.2 /100 | #270 | Tragic 2.5% |
| Cubans | 0.2 /100 | #271 | Tragic 2.5% |
| Immigrants | Bolivia | 0.2 /100 | #272 | Tragic 2.5% |
| Immigrants | Cameroon | 0.1 /100 | #273 | Tragic 2.5% |
| Ghanaians | 0.1 /100 | #274 | Tragic 2.6% |
Demographics Similar to Alsatians by No Schooling Completed
In terms of no schooling completed, the demographic groups most similar to Alsatians are Immigrants from Iran (2.0%, a difference of 0.010%), Immigrants from South Central Asia (2.0%, a difference of 0.20%), Immigrants from Moldova (2.0%, a difference of 0.22%), Soviet Union (2.0%, a difference of 0.40%), and Shoshone (2.0%, a difference of 0.48%).
| Demographics | Rating | Rank | No Schooling Completed |
| Filipinos | 85.5 /100 | #137 | Excellent 2.0% |
| Immigrants | Israel | 85.4 /100 | #138 | Excellent 2.0% |
| Jordanians | 84.5 /100 | #139 | Excellent 2.0% |
| Marshallese | 83.5 /100 | #140 | Excellent 2.0% |
| Immigrants | Greece | 83.5 /100 | #141 | Excellent 2.0% |
| Venezuelans | 81.5 /100 | #142 | Excellent 2.0% |
| Immigrants | South Central Asia | 80.0 /100 | #143 | Good 2.0% |
| Alsatians | 79.1 /100 | #144 | Good 2.0% |
| Immigrants | Iran | 79.0 /100 | #145 | Good 2.0% |
| Immigrants | Moldova | 78.0 /100 | #146 | Good 2.0% |
| Soviet Union | 77.1 /100 | #147 | Good 2.0% |
| Shoshone | 76.7 /100 | #148 | Good 2.0% |
| Immigrants | North Macedonia | 75.9 /100 | #149 | Good 2.0% |
| Blackfeet | 72.9 /100 | #150 | Good 2.0% |
| Immigrants | Jordan | 70.9 /100 | #151 | Good 2.0% |