Immigrants from Bolivia vs Immigrants from Caribbean College, Under 1 year
COMPARE
Immigrants from Bolivia
Immigrants from Caribbean
College, Under 1 year
College, Under 1 year Comparison
Immigrants from Bolivia
Immigrants from Caribbean
67.9%
COLLEGE, UNDER 1 YEAR
97.0/ 100
METRIC RATING
99th/ 347
METRIC RANK
56.6%
COLLEGE, UNDER 1 YEAR
0.0/ 100
METRIC RATING
322nd/ 347
METRIC RANK
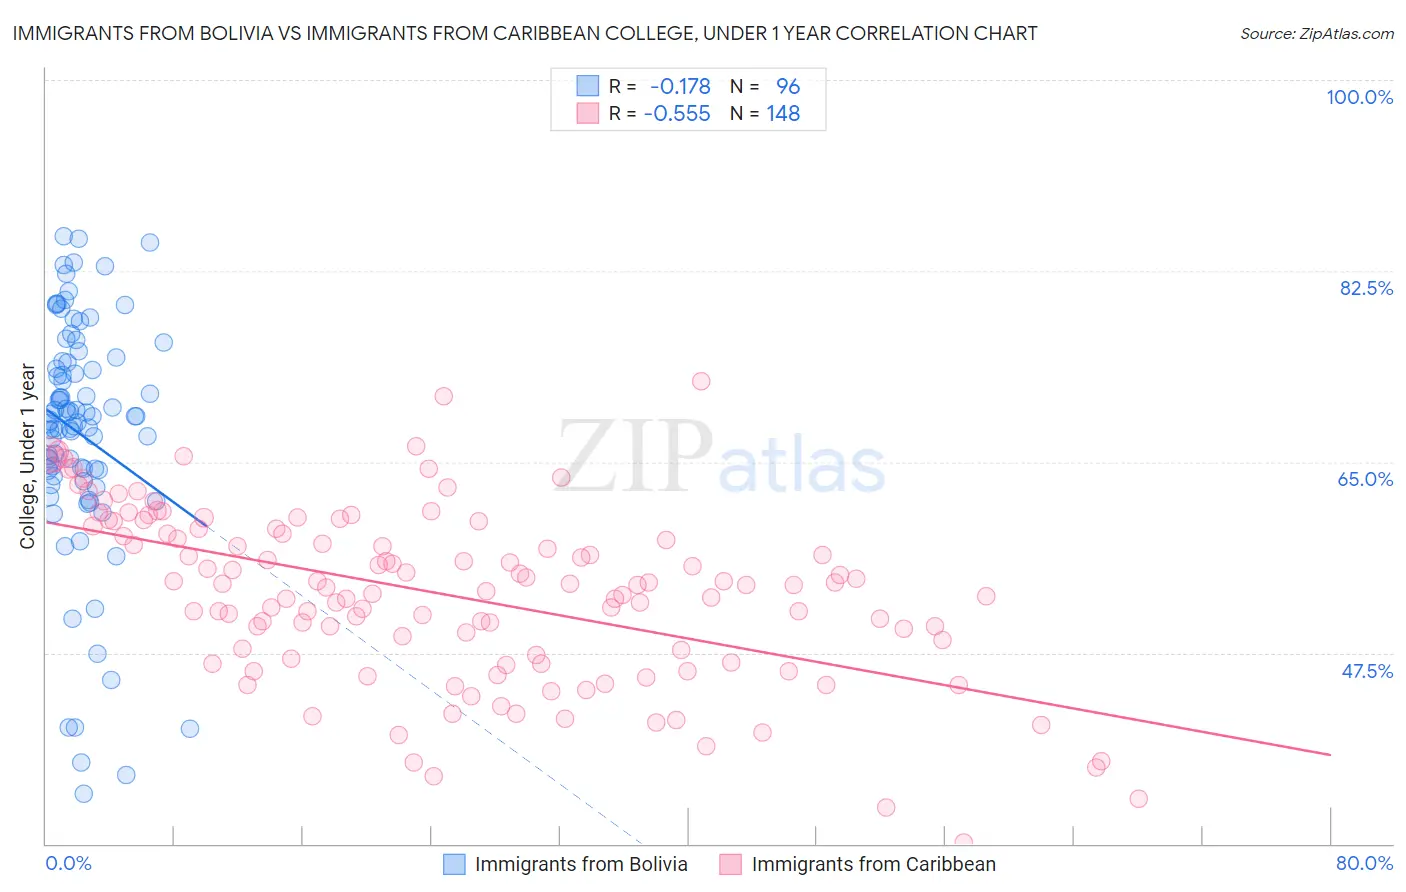
Immigrants from Bolivia vs Immigrants from Caribbean College, Under 1 year Correlation Chart
The statistical analysis conducted on geographies consisting of 158,732,804 people shows a poor negative correlation between the proportion of Immigrants from Bolivia and percentage of population with at least college, under 1 year education in the United States with a correlation coefficient (R) of -0.178 and weighted average of 67.9%. Similarly, the statistical analysis conducted on geographies consisting of 450,062,086 people shows a substantial negative correlation between the proportion of Immigrants from Caribbean and percentage of population with at least college, under 1 year education in the United States with a correlation coefficient (R) of -0.555 and weighted average of 56.6%, a difference of 20.1%.
College, Under 1 year Correlation Summary
| Measurement | Immigrants from Bolivia | Immigrants from Caribbean |
| Minimum | 34.6% | 30.2% |
| Maximum | 85.6% | 72.4% |
| Range | 51.0% | 42.2% |
| Mean | 67.5% | 52.8% |
| Median | 69.0% | 53.7% |
| Interquartile 25% (IQ1) | 64.0% | 47.1% |
| Interquartile 75% (IQ3) | 74.2% | 58.6% |
| Interquartile Range (IQR) | 10.2% | 11.5% |
| Standard Deviation (Sample) | 11.0% | 7.9% |
| Standard Deviation (Population) | 10.9% | 7.9% |
Similar Demographics by College, Under 1 year
Demographics Similar to Immigrants from Bolivia by College, Under 1 year
In terms of college, under 1 year, the demographic groups most similar to Immigrants from Bolivia are Immigrants from Argentina (67.9%, a difference of 0.010%), Paraguayan (67.9%, a difference of 0.020%), Immigrants from Eastern Europe (67.9%, a difference of 0.060%), Palestinian (67.9%, a difference of 0.060%), and Carpatho Rusyn (67.9%, a difference of 0.070%).
| Demographics | Rating | Rank | College, Under 1 year |
| Luxembourgers | 98.1 /100 | #92 | Exceptional 68.2% |
| Romanians | 97.9 /100 | #93 | Exceptional 68.2% |
| Armenians | 97.7 /100 | #94 | Exceptional 68.1% |
| Immigrants | Pakistan | 97.5 /100 | #95 | Exceptional 68.0% |
| Jordanians | 97.4 /100 | #96 | Exceptional 68.0% |
| Immigrants | Ethiopia | 97.3 /100 | #97 | Exceptional 68.0% |
| Paraguayans | 97.1 /100 | #98 | Exceptional 67.9% |
| Immigrants | Bolivia | 97.0 /100 | #99 | Exceptional 67.9% |
| Immigrants | Argentina | 97.0 /100 | #100 | Exceptional 67.9% |
| Immigrants | Eastern Europe | 96.9 /100 | #101 | Exceptional 67.9% |
| Palestinians | 96.9 /100 | #102 | Exceptional 67.9% |
| Carpatho Rusyns | 96.8 /100 | #103 | Exceptional 67.9% |
| Immigrants | Western Asia | 96.6 /100 | #104 | Exceptional 67.8% |
| Afghans | 96.6 /100 | #105 | Exceptional 67.8% |
| Immigrants | Croatia | 96.6 /100 | #106 | Exceptional 67.8% |
Demographics Similar to Immigrants from Caribbean by College, Under 1 year
In terms of college, under 1 year, the demographic groups most similar to Immigrants from Caribbean are Native/Alaskan (56.6%, a difference of 0.13%), Immigrants from Honduras (56.5%, a difference of 0.18%), Immigrants from El Salvador (56.4%, a difference of 0.31%), Guatemalan (56.8%, a difference of 0.39%), and Immigrants from Latin America (56.3%, a difference of 0.41%).
| Demographics | Rating | Rank | College, Under 1 year |
| Hondurans | 0.0 /100 | #315 | Tragic 57.1% |
| Menominee | 0.0 /100 | #316 | Tragic 57.0% |
| Hispanics or Latinos | 0.0 /100 | #317 | Tragic 57.0% |
| Immigrants | Haiti | 0.0 /100 | #318 | Tragic 56.9% |
| Puerto Ricans | 0.0 /100 | #319 | Tragic 56.8% |
| Guatemalans | 0.0 /100 | #320 | Tragic 56.8% |
| Natives/Alaskans | 0.0 /100 | #321 | Tragic 56.6% |
| Immigrants | Caribbean | 0.0 /100 | #322 | Tragic 56.6% |
| Immigrants | Honduras | 0.0 /100 | #323 | Tragic 56.5% |
| Immigrants | El Salvador | 0.0 /100 | #324 | Tragic 56.4% |
| Immigrants | Latin America | 0.0 /100 | #325 | Tragic 56.3% |
| Navajo | 0.0 /100 | #326 | Tragic 56.3% |
| Immigrants | Guatemala | 0.0 /100 | #327 | Tragic 56.2% |
| Cape Verdeans | 0.0 /100 | #328 | Tragic 56.0% |
| Immigrants | Cuba | 0.0 /100 | #329 | Tragic 55.7% |