Immigrants from Bolivia vs Puerto Rican GED/Equivalency
COMPARE
Immigrants from Bolivia
Puerto Rican
GED/Equivalency
GED/Equivalency Comparison
Immigrants from Bolivia
Puerto Ricans
85.8%
GED/EQUIVALENCY
49.8/ 100
METRIC RATING
175th/ 347
METRIC RANK
81.1%
GED/EQUIVALENCY
0.0/ 100
METRIC RATING
308th/ 347
METRIC RANK
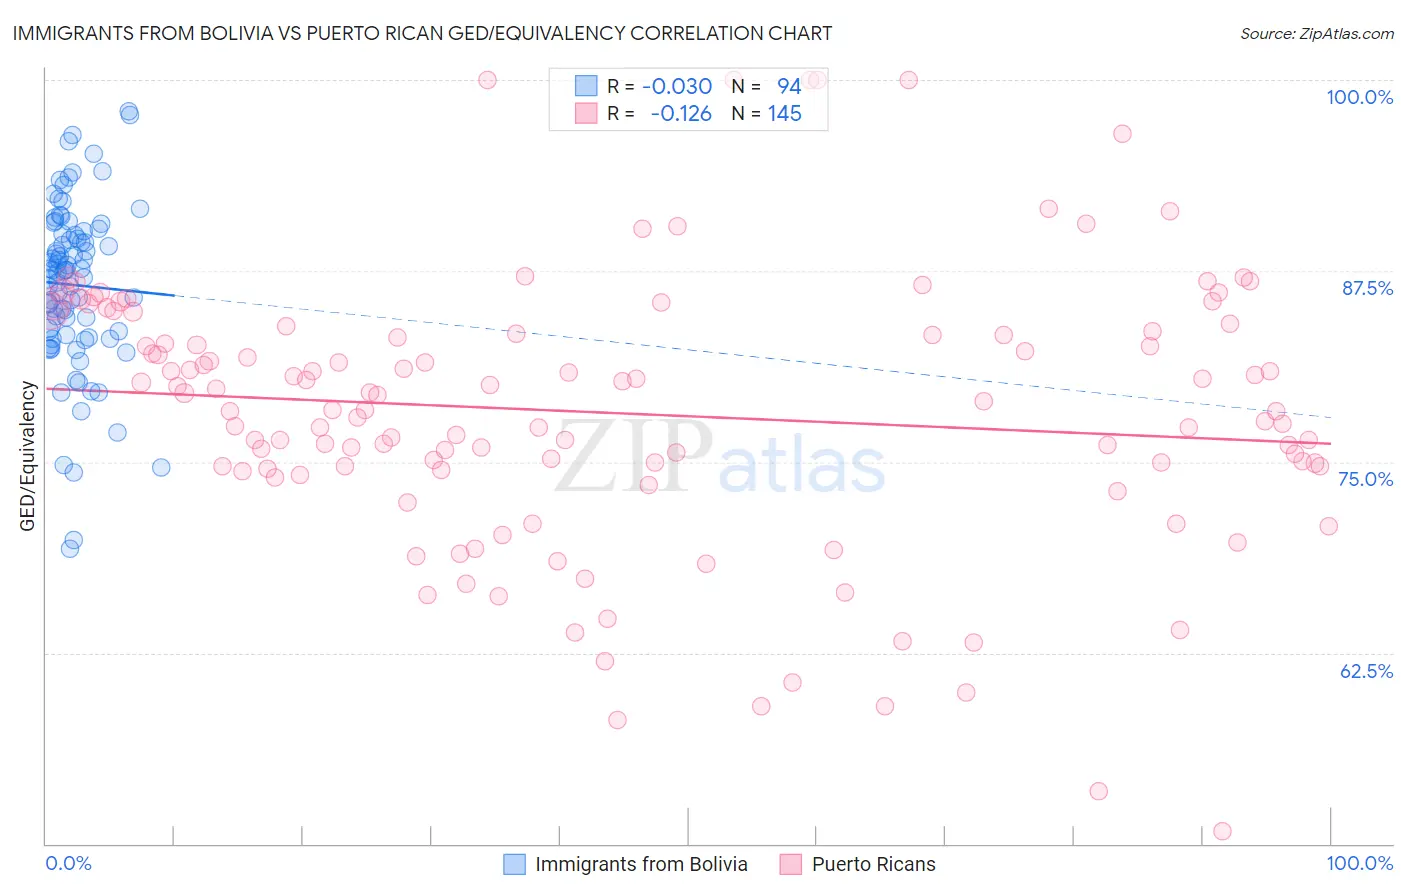
Immigrants from Bolivia vs Puerto Rican GED/Equivalency Correlation Chart
The statistical analysis conducted on geographies consisting of 158,730,894 people shows no correlation between the proportion of Immigrants from Bolivia and percentage of population with at least ged/equivalency education in the United States with a correlation coefficient (R) of -0.030 and weighted average of 85.8%. Similarly, the statistical analysis conducted on geographies consisting of 528,320,760 people shows a poor negative correlation between the proportion of Puerto Ricans and percentage of population with at least ged/equivalency education in the United States with a correlation coefficient (R) of -0.126 and weighted average of 81.1%, a difference of 5.8%.
GED/Equivalency Correlation Summary
| Measurement | Immigrants from Bolivia | Puerto Rican |
| Minimum | 69.3% | 50.8% |
| Maximum | 98.0% | 100.0% |
| Range | 28.7% | 49.2% |
| Mean | 86.6% | 78.2% |
| Median | 87.5% | 78.4% |
| Interquartile 25% (IQ1) | 83.3% | 74.5% |
| Interquartile 75% (IQ3) | 90.0% | 83.5% |
| Interquartile Range (IQR) | 6.7% | 9.0% |
| Standard Deviation (Sample) | 5.5% | 9.0% |
| Standard Deviation (Population) | 5.4% | 8.9% |
Similar Demographics by GED/Equivalency
Demographics Similar to Immigrants from Bolivia by GED/Equivalency
In terms of ged/equivalency, the demographic groups most similar to Immigrants from Bolivia are Ottawa (85.8%, a difference of 0.0%), Immigrants from Venezuela (85.8%, a difference of 0.020%), Immigrants from Eastern Africa (85.7%, a difference of 0.040%), Immigrants from Uganda (85.7%, a difference of 0.10%), and Bermudan (85.8%, a difference of 0.11%).
| Demographics | Rating | Rank | GED/Equivalency |
| Sierra Leoneans | 61.8 /100 | #168 | Good 86.0% |
| Immigrants | Ethiopia | 61.2 /100 | #169 | Good 86.0% |
| Afghans | 59.7 /100 | #170 | Average 85.9% |
| Immigrants | Chile | 57.3 /100 | #171 | Average 85.9% |
| Bermudans | 55.1 /100 | #172 | Average 85.8% |
| Immigrants | Venezuela | 50.7 /100 | #173 | Average 85.8% |
| Ottawa | 50.0 /100 | #174 | Average 85.8% |
| Immigrants | Bolivia | 49.8 /100 | #175 | Average 85.8% |
| Immigrants | Eastern Africa | 47.7 /100 | #176 | Average 85.7% |
| Immigrants | Uganda | 45.2 /100 | #177 | Average 85.7% |
| Koreans | 41.2 /100 | #178 | Average 85.6% |
| Aleuts | 40.5 /100 | #179 | Average 85.6% |
| Immigrants | Southern Europe | 38.4 /100 | #180 | Fair 85.5% |
| Moroccans | 37.7 /100 | #181 | Fair 85.5% |
| Sudanese | 35.2 /100 | #182 | Fair 85.5% |
Demographics Similar to Puerto Ricans by GED/Equivalency
In terms of ged/equivalency, the demographic groups most similar to Puerto Ricans are Immigrants from Ecuador (81.0%, a difference of 0.080%), Immigrants from Dominica (81.1%, a difference of 0.10%), Immigrants from Guyana (81.0%, a difference of 0.14%), Native/Alaskan (80.9%, a difference of 0.14%), and Nicaraguan (80.9%, a difference of 0.18%).
| Demographics | Rating | Rank | GED/Equivalency |
| Dutch West Indians | 0.0 /100 | #301 | Tragic 81.6% |
| Immigrants | Haiti | 0.0 /100 | #302 | Tragic 81.6% |
| Immigrants | Portugal | 0.0 /100 | #303 | Tragic 81.6% |
| Navajo | 0.0 /100 | #304 | Tragic 81.5% |
| Immigrants | Grenada | 0.0 /100 | #305 | Tragic 81.3% |
| Guyanese | 0.0 /100 | #306 | Tragic 81.3% |
| Immigrants | Dominica | 0.0 /100 | #307 | Tragic 81.1% |
| Puerto Ricans | 0.0 /100 | #308 | Tragic 81.1% |
| Immigrants | Ecuador | 0.0 /100 | #309 | Tragic 81.0% |
| Immigrants | Guyana | 0.0 /100 | #310 | Tragic 81.0% |
| Natives/Alaskans | 0.0 /100 | #311 | Tragic 80.9% |
| Nicaraguans | 0.0 /100 | #312 | Tragic 80.9% |
| Cape Verdeans | 0.0 /100 | #313 | Tragic 80.9% |
| Belizeans | 0.0 /100 | #314 | Tragic 80.9% |
| Apache | 0.0 /100 | #315 | Tragic 80.7% |