Immigrants from Bolivia vs Alsatian Median Female Earnings
COMPARE
Immigrants from Bolivia
Alsatian
Median Female Earnings
Median Female Earnings Comparison
Immigrants from Bolivia
Alsatians
$43,467
MEDIAN FEMALE EARNINGS
100.0/ 100
METRIC RATING
46th/ 347
METRIC RANK
$40,060
MEDIAN FEMALE EARNINGS
68.0/ 100
METRIC RATING
161st/ 347
METRIC RANK
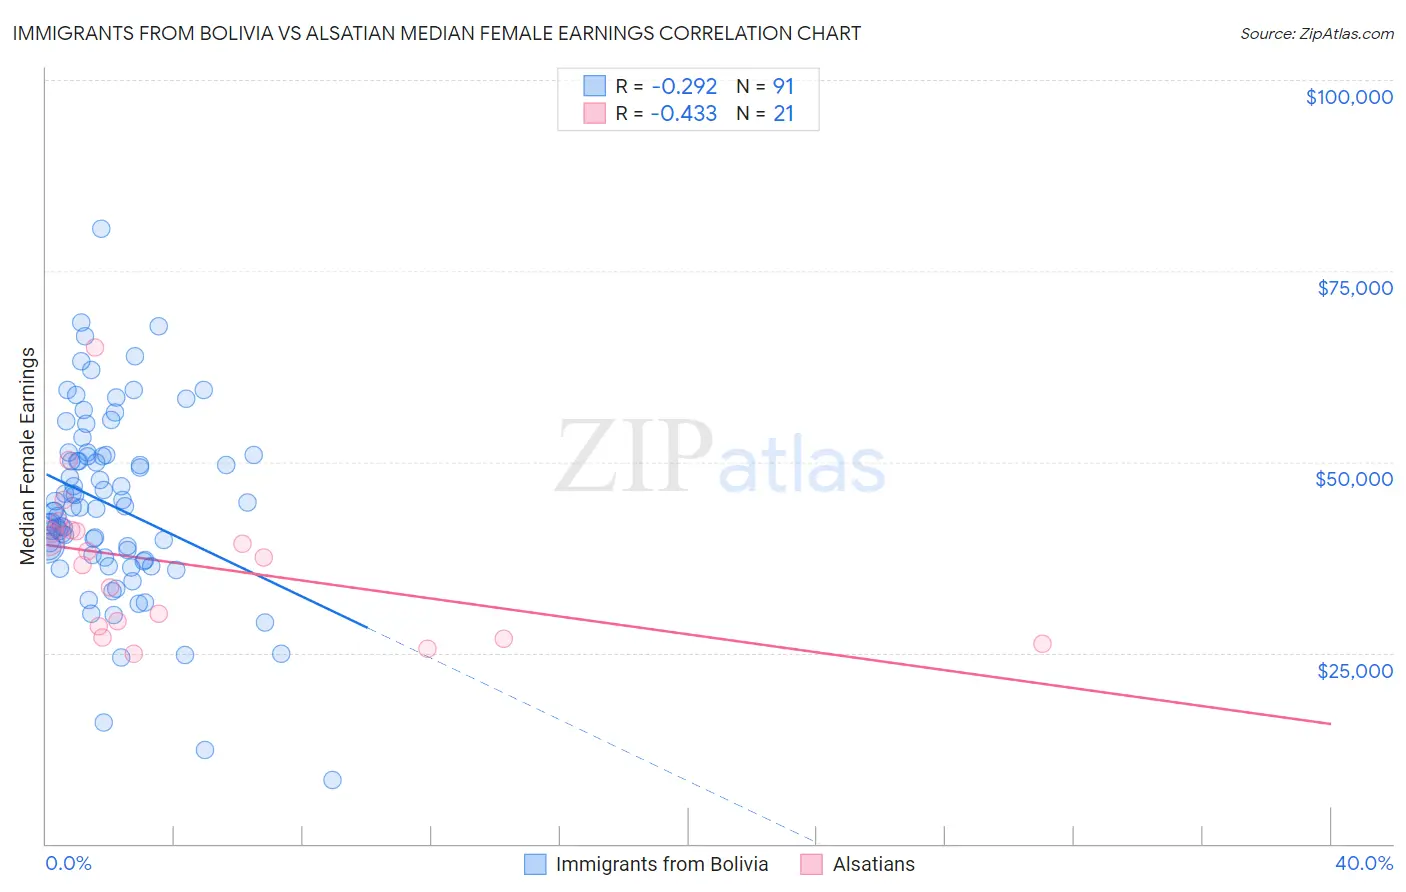
Immigrants from Bolivia vs Alsatian Median Female Earnings Correlation Chart
The statistical analysis conducted on geographies consisting of 158,712,262 people shows a weak negative correlation between the proportion of Immigrants from Bolivia and median female earnings in the United States with a correlation coefficient (R) of -0.292 and weighted average of $43,467. Similarly, the statistical analysis conducted on geographies consisting of 82,671,266 people shows a moderate negative correlation between the proportion of Alsatians and median female earnings in the United States with a correlation coefficient (R) of -0.433 and weighted average of $40,060, a difference of 8.5%.
Median Female Earnings Correlation Summary
| Measurement | Immigrants from Bolivia | Alsatian |
| Minimum | $8,362 | $24,833 |
| Maximum | $80,500 | $65,000 |
| Range | $72,138 | $40,167 |
| Mean | $44,359 | $36,577 |
| Median | $43,989 | $37,425 |
| Interquartile 25% (IQ1) | $37,479 | $27,720 |
| Interquartile 75% (IQ3) | $50,958 | $40,989 |
| Interquartile Range (IQR) | $13,479 | $13,268 |
| Standard Deviation (Sample) | $12,073 | $9,753 |
| Standard Deviation (Population) | $12,007 | $9,518 |
Similar Demographics by Median Female Earnings
Demographics Similar to Immigrants from Bolivia by Median Female Earnings
In terms of median female earnings, the demographic groups most similar to Immigrants from Bolivia are Bolivian ($43,445, a difference of 0.050%), Immigrants from Europe ($43,523, a difference of 0.13%), Immigrants from Indonesia ($43,412, a difference of 0.13%), Immigrants from Serbia ($43,385, a difference of 0.19%), and Immigrants from Czechoslovakia ($43,571, a difference of 0.24%).
| Demographics | Rating | Rank | Median Female Earnings |
| Israelis | 100.0 /100 | #39 | Exceptional $43,852 |
| Immigrants | Malaysia | 100.0 /100 | #40 | Exceptional $43,835 |
| Bhutanese | 100.0 /100 | #41 | Exceptional $43,648 |
| Immigrants | Denmark | 100.0 /100 | #42 | Exceptional $43,646 |
| Bulgarians | 100.0 /100 | #43 | Exceptional $43,638 |
| Immigrants | Czechoslovakia | 100.0 /100 | #44 | Exceptional $43,571 |
| Immigrants | Europe | 100.0 /100 | #45 | Exceptional $43,523 |
| Immigrants | Bolivia | 100.0 /100 | #46 | Exceptional $43,467 |
| Bolivians | 100.0 /100 | #47 | Exceptional $43,445 |
| Immigrants | Indonesia | 100.0 /100 | #48 | Exceptional $43,412 |
| Immigrants | Serbia | 100.0 /100 | #49 | Exceptional $43,385 |
| Immigrants | Uzbekistan | 100.0 /100 | #50 | Exceptional $43,363 |
| Maltese | 100.0 /100 | #51 | Exceptional $43,357 |
| Immigrants | Lithuania | 99.9 /100 | #52 | Exceptional $43,317 |
| Immigrants | Eastern Europe | 99.9 /100 | #53 | Exceptional $43,309 |
Demographics Similar to Alsatians by Median Female Earnings
In terms of median female earnings, the demographic groups most similar to Alsatians are Inupiat ($40,080, a difference of 0.050%), South American Indian ($40,019, a difference of 0.10%), Lebanese ($40,006, a difference of 0.14%), Immigrants from Vietnam ($40,153, a difference of 0.23%), and Immigrants from Senegal ($40,157, a difference of 0.24%).
| Demographics | Rating | Rank | Median Female Earnings |
| Immigrants | Oceania | 77.6 /100 | #154 | Good $40,297 |
| Immigrants | Africa | 76.2 /100 | #155 | Good $40,257 |
| Peruvians | 75.3 /100 | #156 | Good $40,234 |
| Portuguese | 73.0 /100 | #157 | Good $40,177 |
| Immigrants | Senegal | 72.2 /100 | #158 | Good $40,157 |
| Immigrants | Vietnam | 72.0 /100 | #159 | Good $40,153 |
| Inupiat | 68.9 /100 | #160 | Good $40,080 |
| Alsatians | 68.0 /100 | #161 | Good $40,060 |
| South American Indians | 66.1 /100 | #162 | Good $40,019 |
| Lebanese | 65.5 /100 | #163 | Good $40,006 |
| Immigrants | Saudi Arabia | 62.9 /100 | #164 | Good $39,952 |
| Immigrants | Bangladesh | 60.8 /100 | #165 | Good $39,910 |
| Immigrants | Ghana | 60.0 /100 | #166 | Good $39,894 |
| Luxembourgers | 59.9 /100 | #167 | Average $39,891 |
| Immigrants | Peru | 58.9 /100 | #168 | Average $39,871 |