Albanian vs Pima College, Under 1 year
COMPARE
Albanian
Pima
College, Under 1 year
College, Under 1 year Comparison
Albanians
Pima
65.9%
COLLEGE, UNDER 1 YEAR
66.1/ 100
METRIC RATING
160th/ 347
METRIC RANK
51.4%
COLLEGE, UNDER 1 YEAR
0.0/ 100
METRIC RATING
345th/ 347
METRIC RANK
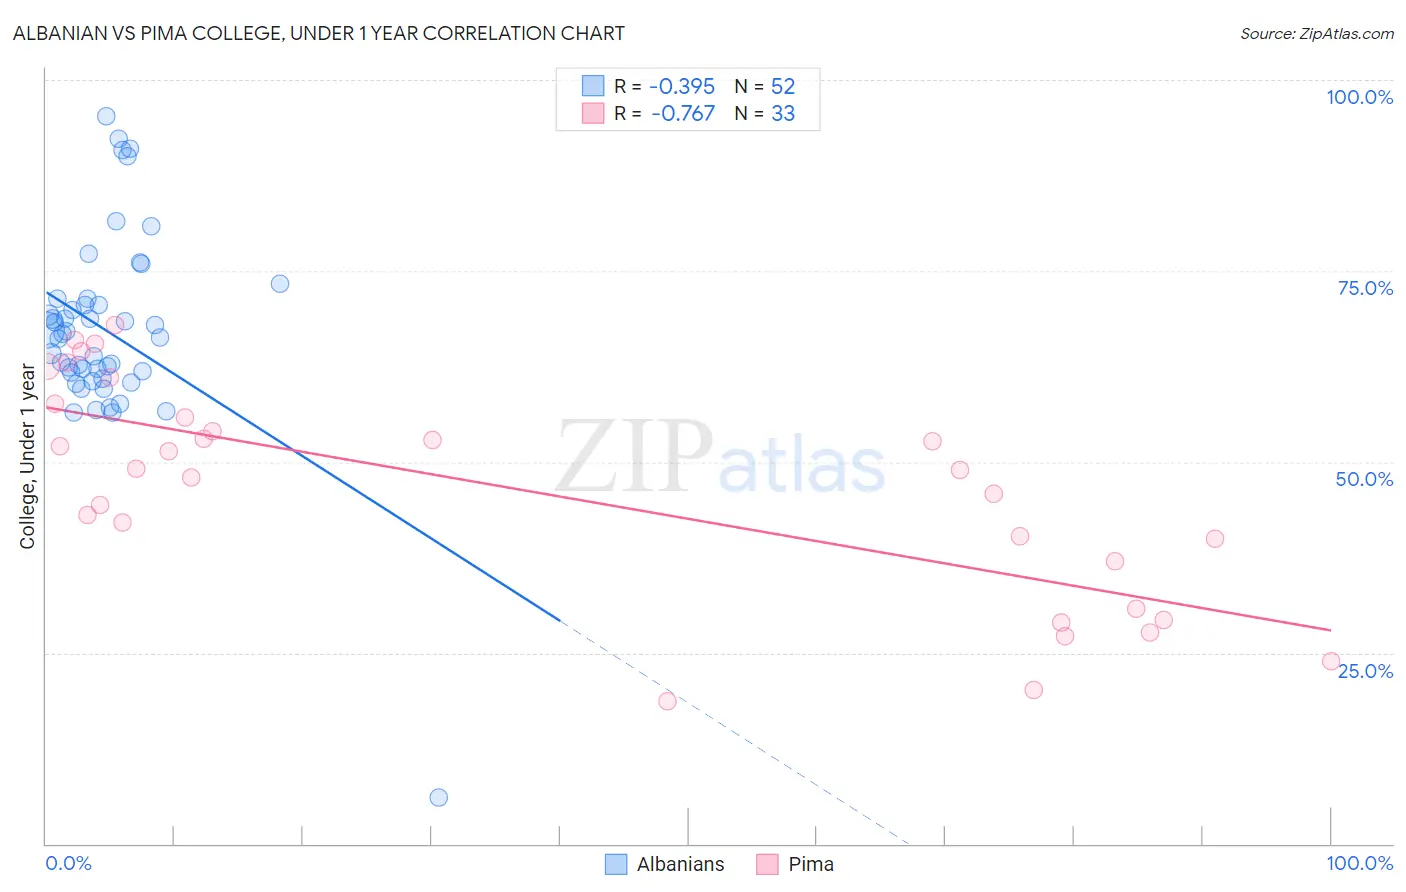
Albanian vs Pima College, Under 1 year Correlation Chart
The statistical analysis conducted on geographies consisting of 193,265,850 people shows a mild negative correlation between the proportion of Albanians and percentage of population with at least college, under 1 year education in the United States with a correlation coefficient (R) of -0.395 and weighted average of 65.9%. Similarly, the statistical analysis conducted on geographies consisting of 61,552,513 people shows a strong negative correlation between the proportion of Pima and percentage of population with at least college, under 1 year education in the United States with a correlation coefficient (R) of -0.767 and weighted average of 51.4%, a difference of 28.2%.
College, Under 1 year Correlation Summary
| Measurement | Albanian | Pima |
| Minimum | 6.0% | 18.7% |
| Maximum | 95.3% | 68.0% |
| Range | 89.3% | 49.3% |
| Mean | 67.1% | 46.2% |
| Median | 66.5% | 48.9% |
| Interquartile 25% (IQ1) | 61.3% | 33.9% |
| Interquartile 75% (IQ3) | 70.9% | 56.7% |
| Interquartile Range (IQR) | 9.6% | 22.9% |
| Standard Deviation (Sample) | 13.1% | 14.2% |
| Standard Deviation (Population) | 13.0% | 14.0% |
Similar Demographics by College, Under 1 year
Demographics Similar to Albanians by College, Under 1 year
In terms of college, under 1 year, the demographic groups most similar to Albanians are Tlingit-Haida (65.9%, a difference of 0.010%), Brazilian (65.9%, a difference of 0.010%), Korean (65.9%, a difference of 0.040%), Celtic (65.9%, a difference of 0.060%), and Sierra Leonean (66.0%, a difference of 0.080%).
| Demographics | Rating | Rank | College, Under 1 year |
| Belgians | 73.7 /100 | #153 | Good 66.2% |
| Immigrants | Eritrea | 71.9 /100 | #154 | Good 66.1% |
| Irish | 70.3 /100 | #155 | Good 66.0% |
| Welsh | 69.9 /100 | #156 | Good 66.0% |
| Sierra Leoneans | 67.8 /100 | #157 | Good 66.0% |
| Celtics | 67.3 /100 | #158 | Good 65.9% |
| Tlingit-Haida | 66.4 /100 | #159 | Good 65.9% |
| Albanians | 66.1 /100 | #160 | Good 65.9% |
| Brazilians | 66.0 /100 | #161 | Good 65.9% |
| Koreans | 65.3 /100 | #162 | Good 65.9% |
| Somalis | 62.7 /100 | #163 | Good 65.8% |
| Czechoslovakians | 62.6 /100 | #164 | Good 65.8% |
| Immigrants | Uzbekistan | 61.6 /100 | #165 | Good 65.8% |
| Moroccans | 56.7 /100 | #166 | Average 65.6% |
| Immigrants | Somalia | 56.4 /100 | #167 | Average 65.6% |
Demographics Similar to Pima by College, Under 1 year
In terms of college, under 1 year, the demographic groups most similar to Pima are Yakama (52.6%, a difference of 2.4%), Tohono O'odham (52.8%, a difference of 2.7%), Immigrants from Mexico (53.7%, a difference of 4.3%), Immigrants from Cabo Verde (53.7%, a difference of 4.4%), and Spanish American Indian (54.0%, a difference of 5.0%).
| Demographics | Rating | Rank | College, Under 1 year |
| Yuman | 0.0 /100 | #333 | Tragic 55.1% |
| Immigrants | Azores | 0.0 /100 | #334 | Tragic 54.7% |
| Inupiat | 0.0 /100 | #335 | Tragic 54.6% |
| Pennsylvania Germans | 0.0 /100 | #336 | Tragic 54.5% |
| Immigrants | Central America | 0.0 /100 | #337 | Tragic 54.4% |
| Lumbee | 0.0 /100 | #338 | Tragic 54.2% |
| Immigrants | Dominican Republic | 0.0 /100 | #339 | Tragic 54.0% |
| Spanish American Indians | 0.0 /100 | #340 | Tragic 54.0% |
| Immigrants | Cabo Verde | 0.0 /100 | #341 | Tragic 53.7% |
| Immigrants | Mexico | 0.0 /100 | #342 | Tragic 53.7% |
| Tohono O'odham | 0.0 /100 | #343 | Tragic 52.8% |
| Yakama | 0.0 /100 | #344 | Tragic 52.6% |
| Pima | 0.0 /100 | #345 | Tragic 51.4% |
| Houma | 0.0 /100 | #346 | Tragic 47.6% |
| Yup'ik | 0.0 /100 | #347 | Tragic 45.8% |