Immigrants from Argentina vs Pima College, Under 1 year
COMPARE
Immigrants from Argentina
Pima
College, Under 1 year
College, Under 1 year Comparison
Immigrants from Argentina
Pima
67.9%
COLLEGE, UNDER 1 YEAR
97.0/ 100
METRIC RATING
100th/ 347
METRIC RANK
51.4%
COLLEGE, UNDER 1 YEAR
0.0/ 100
METRIC RATING
345th/ 347
METRIC RANK
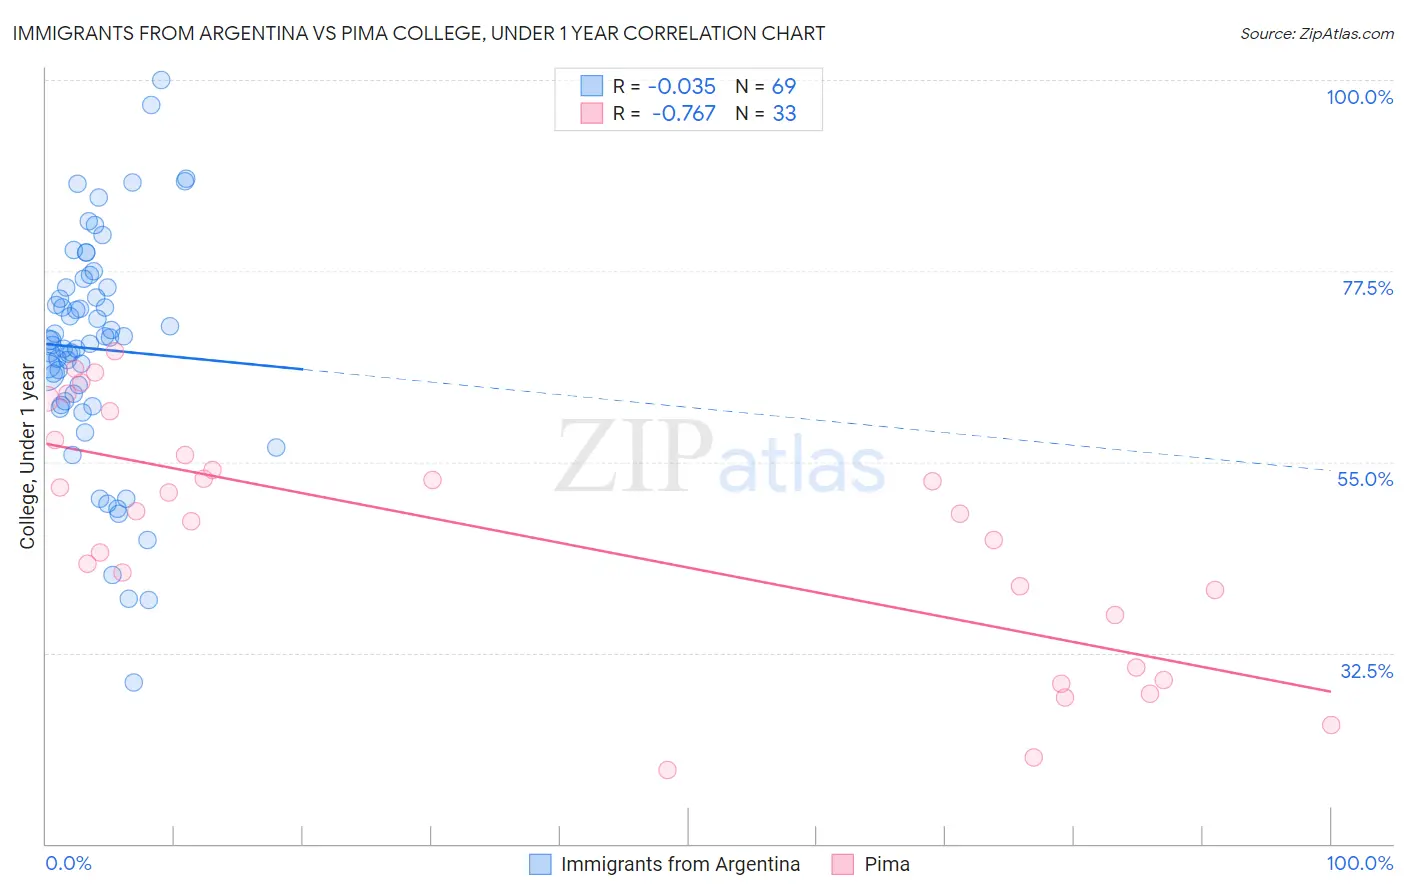
Immigrants from Argentina vs Pima College, Under 1 year Correlation Chart
The statistical analysis conducted on geographies consisting of 264,437,906 people shows no correlation between the proportion of Immigrants from Argentina and percentage of population with at least college, under 1 year education in the United States with a correlation coefficient (R) of -0.035 and weighted average of 67.9%. Similarly, the statistical analysis conducted on geographies consisting of 61,552,513 people shows a strong negative correlation between the proportion of Pima and percentage of population with at least college, under 1 year education in the United States with a correlation coefficient (R) of -0.767 and weighted average of 51.4%, a difference of 32.1%.
College, Under 1 year Correlation Summary
| Measurement | Immigrants from Argentina | Pima |
| Minimum | 29.0% | 18.7% |
| Maximum | 100.0% | 68.0% |
| Range | 71.0% | 49.3% |
| Mean | 68.3% | 46.2% |
| Median | 69.3% | 48.9% |
| Interquartile 25% (IQ1) | 61.9% | 33.9% |
| Interquartile 75% (IQ3) | 75.6% | 56.7% |
| Interquartile Range (IQR) | 13.7% | 22.9% |
| Standard Deviation (Sample) | 13.4% | 14.2% |
| Standard Deviation (Population) | 13.3% | 14.0% |
Similar Demographics by College, Under 1 year
Demographics Similar to Immigrants from Argentina by College, Under 1 year
In terms of college, under 1 year, the demographic groups most similar to Immigrants from Argentina are Immigrants from Bolivia (67.9%, a difference of 0.010%), Paraguayan (67.9%, a difference of 0.030%), Immigrants from Eastern Europe (67.9%, a difference of 0.050%), Palestinian (67.9%, a difference of 0.050%), and Carpatho Rusyn (67.9%, a difference of 0.060%).
| Demographics | Rating | Rank | College, Under 1 year |
| Romanians | 97.9 /100 | #93 | Exceptional 68.2% |
| Armenians | 97.7 /100 | #94 | Exceptional 68.1% |
| Immigrants | Pakistan | 97.5 /100 | #95 | Exceptional 68.0% |
| Jordanians | 97.4 /100 | #96 | Exceptional 68.0% |
| Immigrants | Ethiopia | 97.3 /100 | #97 | Exceptional 68.0% |
| Paraguayans | 97.1 /100 | #98 | Exceptional 67.9% |
| Immigrants | Bolivia | 97.0 /100 | #99 | Exceptional 67.9% |
| Immigrants | Argentina | 97.0 /100 | #100 | Exceptional 67.9% |
| Immigrants | Eastern Europe | 96.9 /100 | #101 | Exceptional 67.9% |
| Palestinians | 96.9 /100 | #102 | Exceptional 67.9% |
| Carpatho Rusyns | 96.8 /100 | #103 | Exceptional 67.9% |
| Immigrants | Western Asia | 96.6 /100 | #104 | Exceptional 67.8% |
| Afghans | 96.6 /100 | #105 | Exceptional 67.8% |
| Immigrants | Croatia | 96.6 /100 | #106 | Exceptional 67.8% |
| Austrians | 96.4 /100 | #107 | Exceptional 67.8% |
Demographics Similar to Pima by College, Under 1 year
In terms of college, under 1 year, the demographic groups most similar to Pima are Yakama (52.6%, a difference of 2.4%), Tohono O'odham (52.8%, a difference of 2.7%), Immigrants from Mexico (53.7%, a difference of 4.3%), Immigrants from Cabo Verde (53.7%, a difference of 4.4%), and Spanish American Indian (54.0%, a difference of 5.0%).
| Demographics | Rating | Rank | College, Under 1 year |
| Yuman | 0.0 /100 | #333 | Tragic 55.1% |
| Immigrants | Azores | 0.0 /100 | #334 | Tragic 54.7% |
| Inupiat | 0.0 /100 | #335 | Tragic 54.6% |
| Pennsylvania Germans | 0.0 /100 | #336 | Tragic 54.5% |
| Immigrants | Central America | 0.0 /100 | #337 | Tragic 54.4% |
| Lumbee | 0.0 /100 | #338 | Tragic 54.2% |
| Immigrants | Dominican Republic | 0.0 /100 | #339 | Tragic 54.0% |
| Spanish American Indians | 0.0 /100 | #340 | Tragic 54.0% |
| Immigrants | Cabo Verde | 0.0 /100 | #341 | Tragic 53.7% |
| Immigrants | Mexico | 0.0 /100 | #342 | Tragic 53.7% |
| Tohono O'odham | 0.0 /100 | #343 | Tragic 52.8% |
| Yakama | 0.0 /100 | #344 | Tragic 52.6% |
| Pima | 0.0 /100 | #345 | Tragic 51.4% |
| Houma | 0.0 /100 | #346 | Tragic 47.6% |
| Yup'ik | 0.0 /100 | #347 | Tragic 45.8% |