Immigrants from Belgium vs Yuman College, 1 year or more
COMPARE
Immigrants from Belgium
Yuman
College, 1 year or more
College, 1 year or more Comparison
Immigrants from Belgium
Yuman
66.3%
COLLEGE, 1 YEAR OR MORE
100.0/ 100
METRIC RATING
24th/ 347
METRIC RANK
48.7%
COLLEGE, 1 YEAR OR MORE
0.0/ 100
METRIC RATING
335th/ 347
METRIC RANK
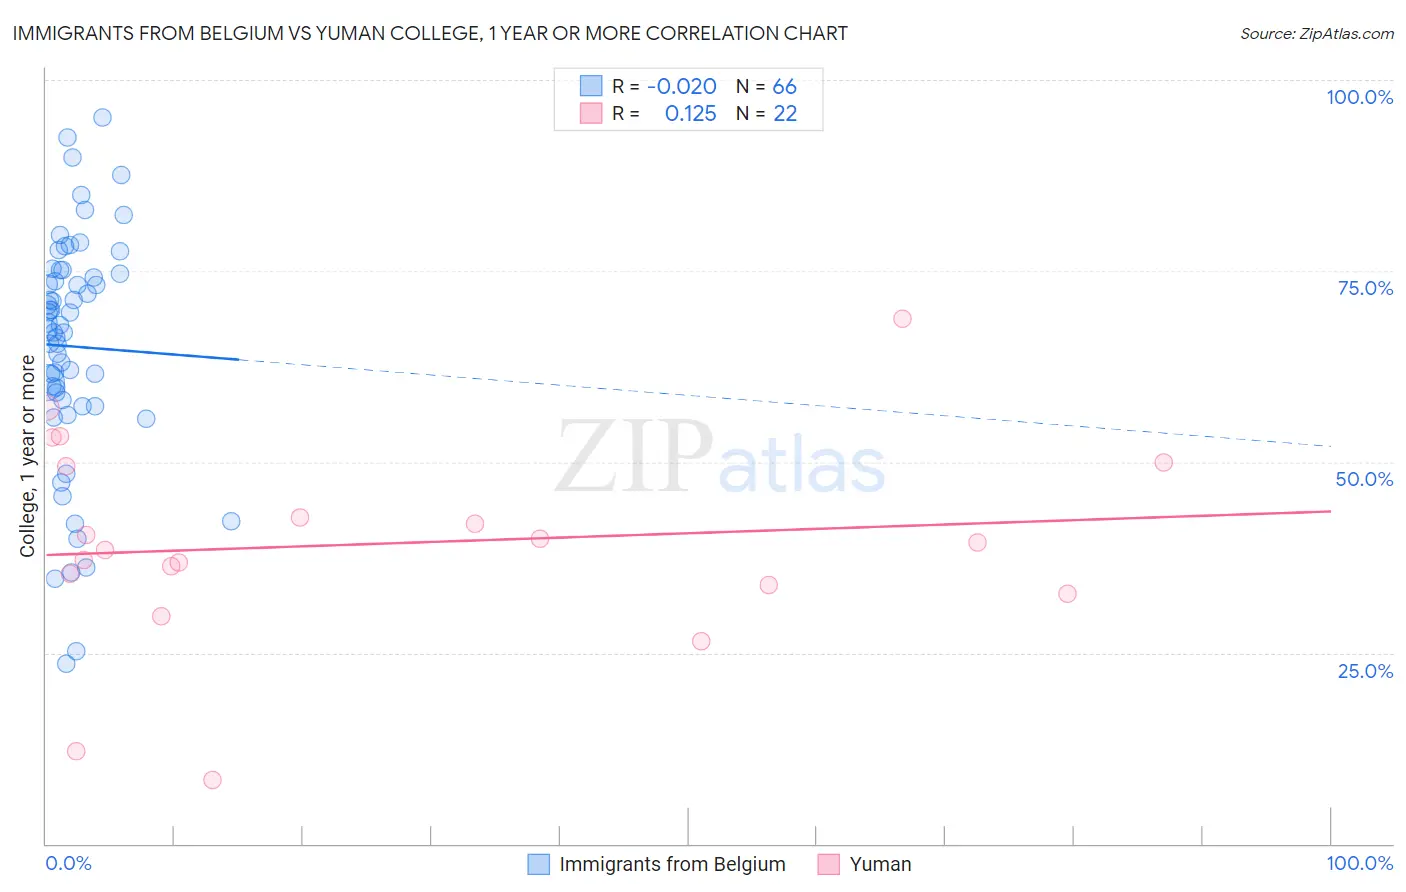
Immigrants from Belgium vs Yuman College, 1 year or more Correlation Chart
The statistical analysis conducted on geographies consisting of 146,729,232 people shows no correlation between the proportion of Immigrants from Belgium and percentage of population with at least college, 1 year or more education in the United States with a correlation coefficient (R) of -0.020 and weighted average of 66.3%. Similarly, the statistical analysis conducted on geographies consisting of 40,696,202 people shows a poor positive correlation between the proportion of Yuman and percentage of population with at least college, 1 year or more education in the United States with a correlation coefficient (R) of 0.125 and weighted average of 48.7%, a difference of 36.1%.
College, 1 year or more Correlation Summary
| Measurement | Immigrants from Belgium | Yuman |
| Minimum | 23.6% | 8.3% |
| Maximum | 95.1% | 68.8% |
| Range | 71.6% | 60.4% |
| Mean | 65.1% | 39.3% |
| Median | 67.6% | 39.0% |
| Interquartile 25% (IQ1) | 58.2% | 34.0% |
| Interquartile 75% (IQ3) | 74.7% | 49.5% |
| Interquartile Range (IQR) | 16.5% | 15.5% |
| Standard Deviation (Sample) | 15.3% | 13.6% |
| Standard Deviation (Population) | 15.1% | 13.3% |
Similar Demographics by College, 1 year or more
Demographics Similar to Immigrants from Belgium by College, 1 year or more
In terms of college, 1 year or more, the demographic groups most similar to Immigrants from Belgium are Immigrants from China (66.4%, a difference of 0.080%), Soviet Union (66.4%, a difference of 0.14%), Immigrants from Hong Kong (66.4%, a difference of 0.20%), Immigrants from Korea (66.5%, a difference of 0.27%), and Immigrants from Switzerland (66.5%, a difference of 0.31%).
| Demographics | Rating | Rank | College, 1 year or more |
| Immigrants | Eastern Asia | 100.0 /100 | #17 | Exceptional 66.6% |
| Eastern Europeans | 100.0 /100 | #18 | Exceptional 66.6% |
| Immigrants | Switzerland | 100.0 /100 | #19 | Exceptional 66.5% |
| Immigrants | Korea | 100.0 /100 | #20 | Exceptional 66.5% |
| Immigrants | Hong Kong | 100.0 /100 | #21 | Exceptional 66.4% |
| Soviet Union | 100.0 /100 | #22 | Exceptional 66.4% |
| Immigrants | China | 100.0 /100 | #23 | Exceptional 66.4% |
| Immigrants | Belgium | 100.0 /100 | #24 | Exceptional 66.3% |
| Indians (Asian) | 100.0 /100 | #25 | Exceptional 66.1% |
| Latvians | 100.0 /100 | #26 | Exceptional 66.1% |
| Immigrants | Ireland | 100.0 /100 | #27 | Exceptional 65.9% |
| Immigrants | France | 100.0 /100 | #28 | Exceptional 65.8% |
| Immigrants | Northern Europe | 100.0 /100 | #29 | Exceptional 65.6% |
| Immigrants | Denmark | 100.0 /100 | #30 | Exceptional 65.6% |
| Turks | 100.0 /100 | #31 | Exceptional 65.5% |
Demographics Similar to Yuman by College, 1 year or more
In terms of college, 1 year or more, the demographic groups most similar to Yuman are Lumbee (48.9%, a difference of 0.28%), Spanish American Indian (48.5%, a difference of 0.44%), Pennsylvania German (48.5%, a difference of 0.45%), Immigrants from Central America (48.5%, a difference of 0.50%), and Immigrants from the Azores (48.4%, a difference of 0.76%).
| Demographics | Rating | Rank | College, 1 year or more |
| Dutch West Indians | 0.0 /100 | #328 | Tragic 50.5% |
| Cape Verdeans | 0.0 /100 | #329 | Tragic 50.3% |
| Natives/Alaskans | 0.0 /100 | #330 | Tragic 50.2% |
| Immigrants | Yemen | 0.0 /100 | #331 | Tragic 50.0% |
| Mexicans | 0.0 /100 | #332 | Tragic 49.2% |
| Immigrants | Dominican Republic | 0.0 /100 | #333 | Tragic 49.1% |
| Lumbee | 0.0 /100 | #334 | Tragic 48.9% |
| Yuman | 0.0 /100 | #335 | Tragic 48.7% |
| Spanish American Indians | 0.0 /100 | #336 | Tragic 48.5% |
| Pennsylvania Germans | 0.0 /100 | #337 | Tragic 48.5% |
| Immigrants | Central America | 0.0 /100 | #338 | Tragic 48.5% |
| Immigrants | Azores | 0.0 /100 | #339 | Tragic 48.4% |
| Immigrants | Cabo Verde | 0.0 /100 | #340 | Tragic 48.1% |
| Immigrants | Mexico | 0.0 /100 | #341 | Tragic 47.5% |
| Inupiat | 0.0 /100 | #342 | Tragic 47.2% |