Immigrants from Belgium vs Immigrants from Poland In Labor Force | Age 30-34
COMPARE
Immigrants from Belgium
Immigrants from Poland
In Labor Force | Age 30-34
In Labor Force | Age 30-34 Comparison
Immigrants from Belgium
Immigrants from Poland
85.3%
IN LABOR FORCE | AGE 30-34
98.2/ 100
METRIC RATING
88th/ 347
METRIC RANK
85.5%
IN LABOR FORCE | AGE 30-34
99.5/ 100
METRIC RATING
59th/ 347
METRIC RANK
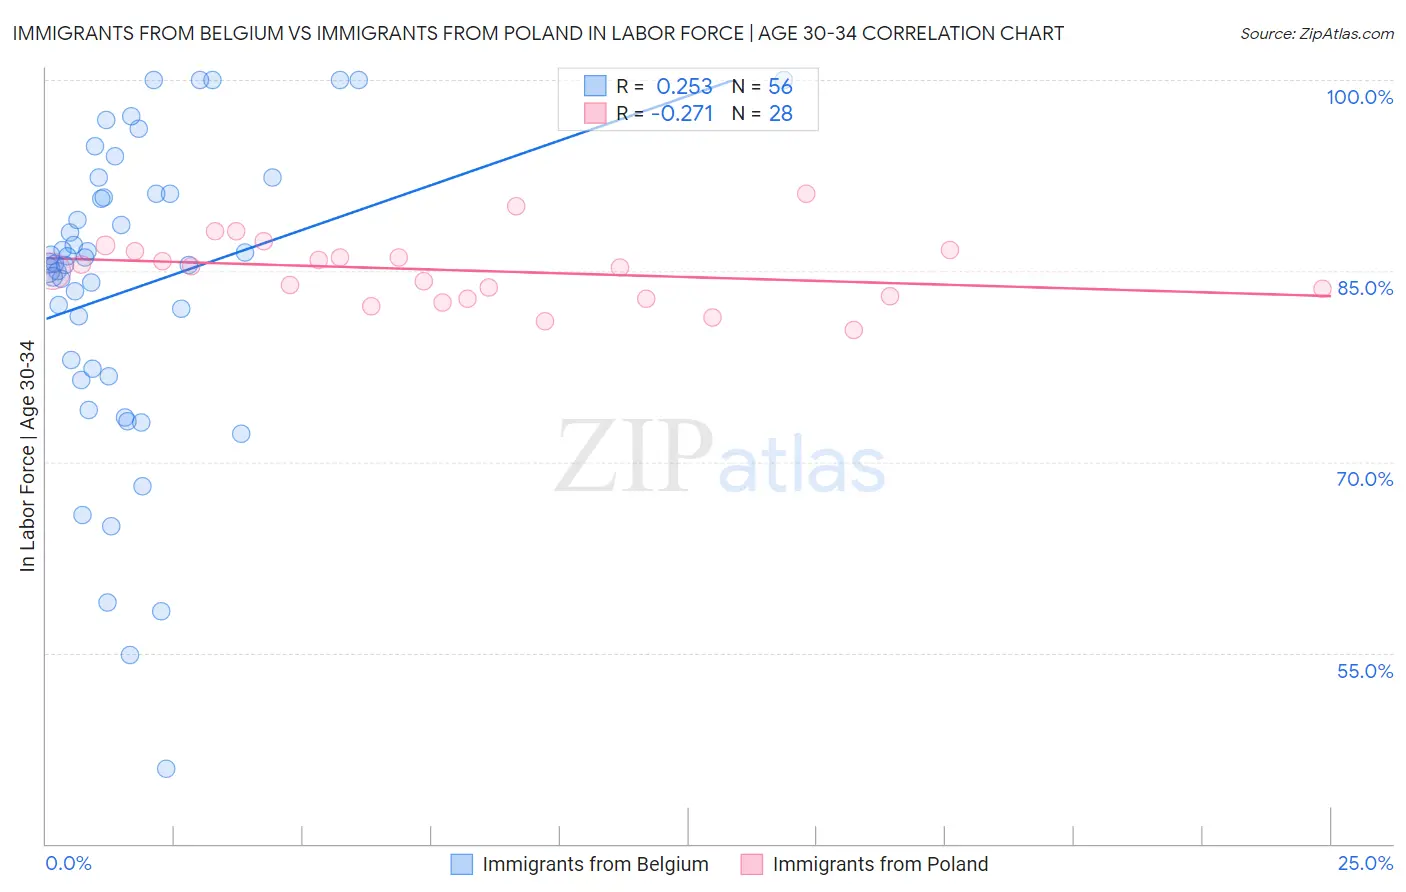
Immigrants from Belgium vs Immigrants from Poland In Labor Force | Age 30-34 Correlation Chart
The statistical analysis conducted on geographies consisting of 146,692,103 people shows a weak positive correlation between the proportion of Immigrants from Belgium and labor force participation rate among population between the ages 30 and 34 in the United States with a correlation coefficient (R) of 0.253 and weighted average of 85.3%. Similarly, the statistical analysis conducted on geographies consisting of 304,756,662 people shows a weak negative correlation between the proportion of Immigrants from Poland and labor force participation rate among population between the ages 30 and 34 in the United States with a correlation coefficient (R) of -0.271 and weighted average of 85.5%, a difference of 0.24%.
In Labor Force | Age 30-34 Correlation Summary
| Measurement | Immigrants from Belgium | Immigrants from Poland |
| Minimum | 45.9% | 80.4% |
| Maximum | 100.0% | 91.1% |
| Range | 54.1% | 10.7% |
| Mean | 83.6% | 85.0% |
| Median | 85.6% | 85.3% |
| Interquartile 25% (IQ1) | 77.0% | 82.9% |
| Interquartile 75% (IQ3) | 91.1% | 86.6% |
| Interquartile Range (IQR) | 14.1% | 3.7% |
| Standard Deviation (Sample) | 12.1% | 2.6% |
| Standard Deviation (Population) | 12.0% | 2.6% |
Similar Demographics by In Labor Force | Age 30-34
Demographics Similar to Immigrants from Belgium by In Labor Force | Age 30-34
In terms of in labor force | age 30-34, the demographic groups most similar to Immigrants from Belgium are Immigrants from Taiwan (85.3%, a difference of 0.010%), Immigrants from Northern Europe (85.3%, a difference of 0.010%), Immigrants from Kazakhstan (85.3%, a difference of 0.010%), Burmese (85.3%, a difference of 0.020%), and Mongolian (85.3%, a difference of 0.030%).
| Demographics | Rating | Rank | In Labor Force | Age 30-34 |
| Slovaks | 98.7 /100 | #81 | Exceptional 85.3% |
| Immigrants | Africa | 98.6 /100 | #82 | Exceptional 85.3% |
| Immigrants | Europe | 98.6 /100 | #83 | Exceptional 85.3% |
| Greeks | 98.6 /100 | #84 | Exceptional 85.3% |
| Mongolians | 98.5 /100 | #85 | Exceptional 85.3% |
| Immigrants | Taiwan | 98.3 /100 | #86 | Exceptional 85.3% |
| Immigrants | Northern Europe | 98.2 /100 | #87 | Exceptional 85.3% |
| Immigrants | Belgium | 98.2 /100 | #88 | Exceptional 85.3% |
| Immigrants | Kazakhstan | 98.1 /100 | #89 | Exceptional 85.3% |
| Burmese | 97.9 /100 | #90 | Exceptional 85.3% |
| Immigrants | Moldova | 97.9 /100 | #91 | Exceptional 85.3% |
| German Russians | 97.7 /100 | #92 | Exceptional 85.2% |
| Immigrants | Norway | 97.6 /100 | #93 | Exceptional 85.2% |
| Swedes | 97.5 /100 | #94 | Exceptional 85.2% |
| Immigrants | India | 97.4 /100 | #95 | Exceptional 85.2% |
Demographics Similar to Immigrants from Poland by In Labor Force | Age 30-34
In terms of in labor force | age 30-34, the demographic groups most similar to Immigrants from Poland are Polish (85.5%, a difference of 0.010%), Immigrants from Turkey (85.5%, a difference of 0.020%), Czech (85.5%, a difference of 0.020%), Russian (85.5%, a difference of 0.020%), and Immigrants from France (85.5%, a difference of 0.020%).
| Demographics | Rating | Rank | In Labor Force | Age 30-34 |
| Slovenes | 99.7 /100 | #52 | Exceptional 85.6% |
| Filipinos | 99.6 /100 | #53 | Exceptional 85.5% |
| Immigrants | Kenya | 99.6 /100 | #54 | Exceptional 85.5% |
| Immigrants | Turkey | 99.6 /100 | #55 | Exceptional 85.5% |
| Czechs | 99.6 /100 | #56 | Exceptional 85.5% |
| Russians | 99.6 /100 | #57 | Exceptional 85.5% |
| Poles | 99.6 /100 | #58 | Exceptional 85.5% |
| Immigrants | Poland | 99.5 /100 | #59 | Exceptional 85.5% |
| Immigrants | France | 99.5 /100 | #60 | Exceptional 85.5% |
| Immigrants | Brazil | 99.5 /100 | #61 | Exceptional 85.5% |
| Soviet Union | 99.4 /100 | #62 | Exceptional 85.5% |
| Macedonians | 99.4 /100 | #63 | Exceptional 85.5% |
| Italians | 99.4 /100 | #64 | Exceptional 85.4% |
| Senegalese | 99.4 /100 | #65 | Exceptional 85.4% |
| Ghanaians | 99.4 /100 | #66 | Exceptional 85.4% |