Immigrants from Belgium vs Immigrants from India College, 1 year or more
COMPARE
Immigrants from Belgium
Immigrants from India
College, 1 year or more
College, 1 year or more Comparison
Immigrants from Belgium
Immigrants from India
66.3%
COLLEGE, 1 YEAR OR MORE
100.0/ 100
METRIC RATING
24th/ 347
METRIC RANK
69.6%
COLLEGE, 1 YEAR OR MORE
100.0/ 100
METRIC RATING
5th/ 347
METRIC RANK
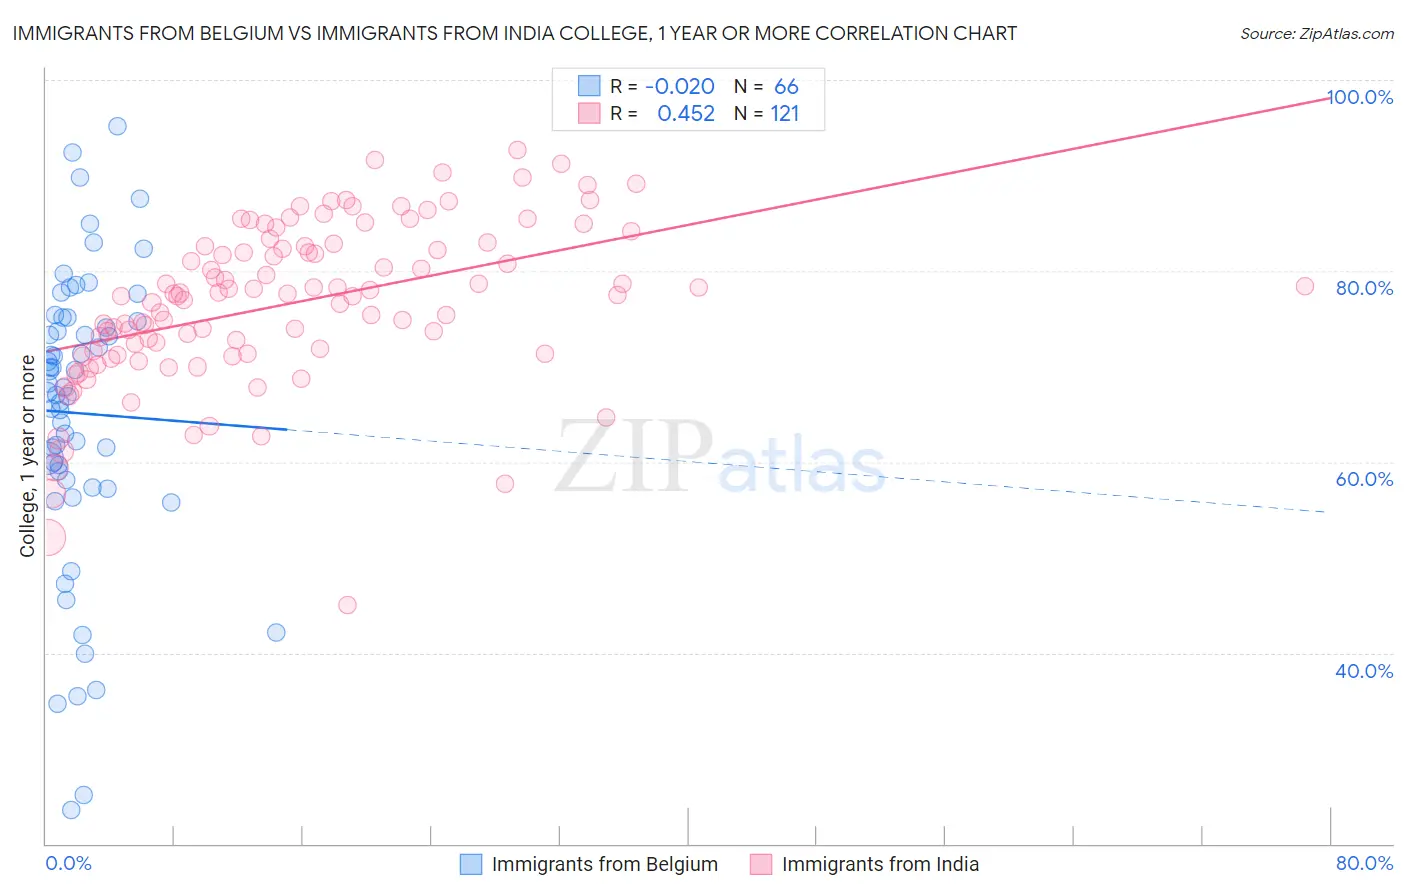
Immigrants from Belgium vs Immigrants from India College, 1 year or more Correlation Chart
The statistical analysis conducted on geographies consisting of 146,729,232 people shows no correlation between the proportion of Immigrants from Belgium and percentage of population with at least college, 1 year or more education in the United States with a correlation coefficient (R) of -0.020 and weighted average of 66.3%. Similarly, the statistical analysis conducted on geographies consisting of 434,099,848 people shows a moderate positive correlation between the proportion of Immigrants from India and percentage of population with at least college, 1 year or more education in the United States with a correlation coefficient (R) of 0.452 and weighted average of 69.6%, a difference of 5.0%.
College, 1 year or more Correlation Summary
| Measurement | Immigrants from Belgium | Immigrants from India |
| Minimum | 23.6% | 45.0% |
| Maximum | 95.1% | 92.6% |
| Range | 71.6% | 47.7% |
| Mean | 65.1% | 76.6% |
| Median | 67.6% | 77.4% |
| Interquartile 25% (IQ1) | 58.2% | 71.3% |
| Interquartile 75% (IQ3) | 74.7% | 82.6% |
| Interquartile Range (IQR) | 16.5% | 11.3% |
| Standard Deviation (Sample) | 15.3% | 8.5% |
| Standard Deviation (Population) | 15.1% | 8.5% |
Demographics Similar to Immigrants from Belgium and Immigrants from India by College, 1 year or more
In terms of college, 1 year or more, the demographic groups most similar to Immigrants from Belgium are Immigrants from China (66.4%, a difference of 0.080%), Soviet Union (66.4%, a difference of 0.14%), Immigrants from Hong Kong (66.4%, a difference of 0.20%), Immigrants from Korea (66.5%, a difference of 0.27%), and Immigrants from Switzerland (66.5%, a difference of 0.31%). Similarly, the demographic groups most similar to Immigrants from India are Immigrants from Taiwan (69.6%, a difference of 0.0%), Immigrants from Iran (69.5%, a difference of 0.20%), Okinawan (69.0%, a difference of 0.97%), Thai (68.6%, a difference of 1.5%), and Immigrants from Israel (67.8%, a difference of 2.7%).
| Demographics | Rating | Rank | College, 1 year or more |
| Immigrants | Taiwan | 100.0 /100 | #4 | Exceptional 69.6% |
| Immigrants | India | 100.0 /100 | #5 | Exceptional 69.6% |
| Immigrants | Iran | 100.0 /100 | #6 | Exceptional 69.5% |
| Okinawans | 100.0 /100 | #7 | Exceptional 69.0% |
| Thais | 100.0 /100 | #8 | Exceptional 68.6% |
| Immigrants | Israel | 100.0 /100 | #9 | Exceptional 67.8% |
| Immigrants | Australia | 100.0 /100 | #10 | Exceptional 67.7% |
| Immigrants | South Central Asia | 100.0 /100 | #11 | Exceptional 67.1% |
| Cypriots | 100.0 /100 | #12 | Exceptional 67.0% |
| Immigrants | Sweden | 100.0 /100 | #13 | Exceptional 66.8% |
| Burmese | 100.0 /100 | #14 | Exceptional 66.7% |
| Cambodians | 100.0 /100 | #15 | Exceptional 66.7% |
| Immigrants | Japan | 100.0 /100 | #16 | Exceptional 66.7% |
| Immigrants | Eastern Asia | 100.0 /100 | #17 | Exceptional 66.6% |
| Eastern Europeans | 100.0 /100 | #18 | Exceptional 66.6% |
| Immigrants | Switzerland | 100.0 /100 | #19 | Exceptional 66.5% |
| Immigrants | Korea | 100.0 /100 | #20 | Exceptional 66.5% |
| Immigrants | Hong Kong | 100.0 /100 | #21 | Exceptional 66.4% |
| Soviet Union | 100.0 /100 | #22 | Exceptional 66.4% |
| Immigrants | China | 100.0 /100 | #23 | Exceptional 66.4% |
| Immigrants | Belgium | 100.0 /100 | #24 | Exceptional 66.3% |