Immigrants from Belgium vs Native Hawaiian College, 1 year or more
COMPARE
Immigrants from Belgium
Native Hawaiian
College, 1 year or more
College, 1 year or more Comparison
Immigrants from Belgium
Native Hawaiians
66.3%
COLLEGE, 1 YEAR OR MORE
100.0/ 100
METRIC RATING
24th/ 347
METRIC RANK
57.6%
COLLEGE, 1 YEAR OR MORE
9.0/ 100
METRIC RATING
218th/ 347
METRIC RANK
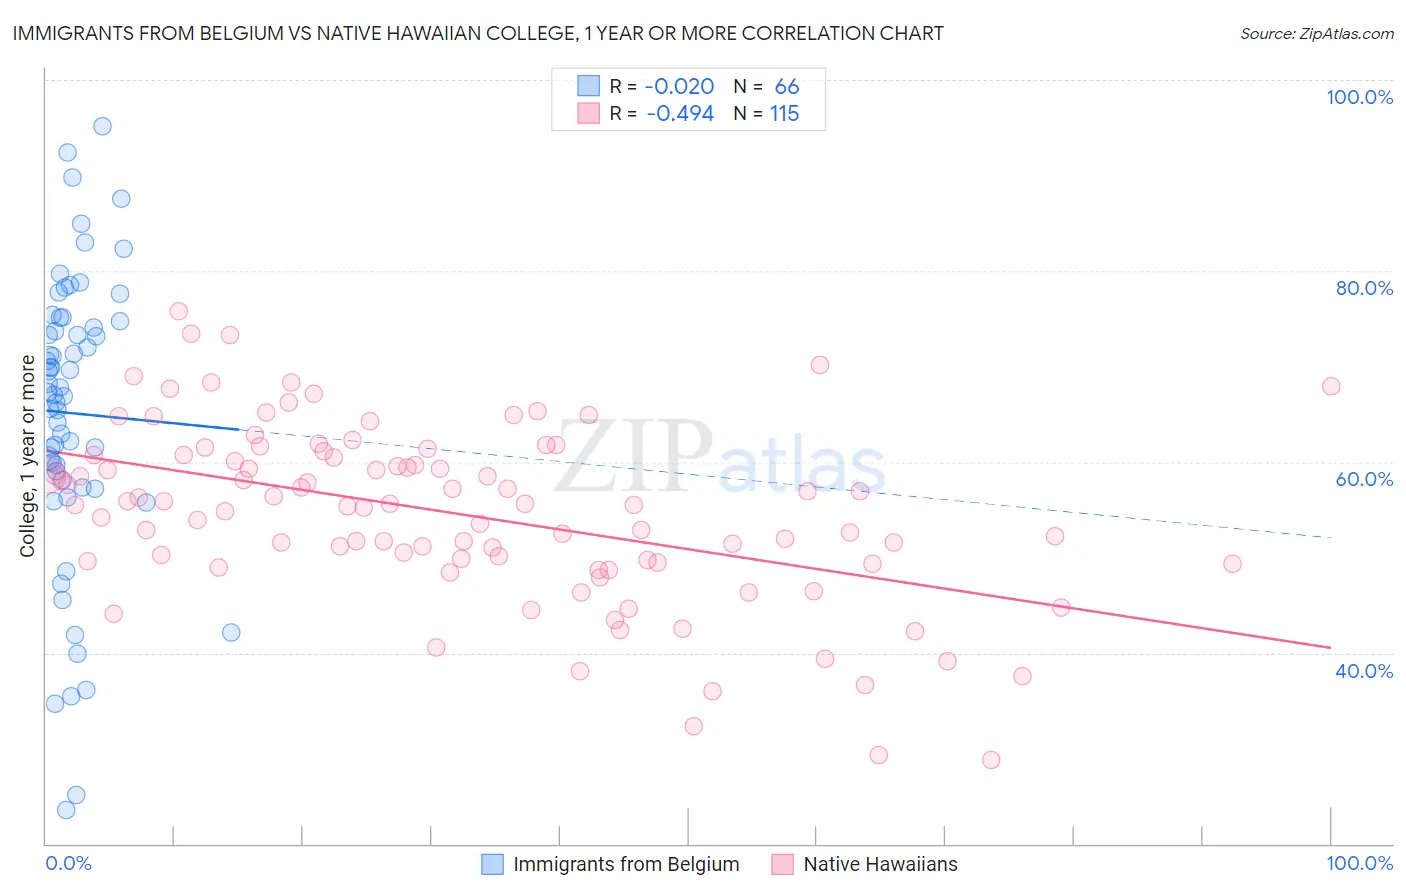
Immigrants from Belgium vs Native Hawaiian College, 1 year or more Correlation Chart
The statistical analysis conducted on geographies consisting of 146,729,232 people shows no correlation between the proportion of Immigrants from Belgium and percentage of population with at least college, 1 year or more education in the United States with a correlation coefficient (R) of -0.020 and weighted average of 66.3%. Similarly, the statistical analysis conducted on geographies consisting of 332,118,930 people shows a moderate negative correlation between the proportion of Native Hawaiians and percentage of population with at least college, 1 year or more education in the United States with a correlation coefficient (R) of -0.494 and weighted average of 57.6%, a difference of 15.1%.
College, 1 year or more Correlation Summary
| Measurement | Immigrants from Belgium | Native Hawaiian |
| Minimum | 23.6% | 28.7% |
| Maximum | 95.1% | 75.7% |
| Range | 71.6% | 47.0% |
| Mean | 65.1% | 54.6% |
| Median | 67.6% | 55.5% |
| Interquartile 25% (IQ1) | 58.2% | 49.5% |
| Interquartile 75% (IQ3) | 74.7% | 60.7% |
| Interquartile Range (IQR) | 16.5% | 11.2% |
| Standard Deviation (Sample) | 15.3% | 9.2% |
| Standard Deviation (Population) | 15.1% | 9.2% |
Similar Demographics by College, 1 year or more
Demographics Similar to Immigrants from Belgium by College, 1 year or more
In terms of college, 1 year or more, the demographic groups most similar to Immigrants from Belgium are Immigrants from China (66.4%, a difference of 0.080%), Soviet Union (66.4%, a difference of 0.14%), Immigrants from Hong Kong (66.4%, a difference of 0.20%), Immigrants from Korea (66.5%, a difference of 0.27%), and Immigrants from Switzerland (66.5%, a difference of 0.31%).
| Demographics | Rating | Rank | College, 1 year or more |
| Immigrants | Eastern Asia | 100.0 /100 | #17 | Exceptional 66.6% |
| Eastern Europeans | 100.0 /100 | #18 | Exceptional 66.6% |
| Immigrants | Switzerland | 100.0 /100 | #19 | Exceptional 66.5% |
| Immigrants | Korea | 100.0 /100 | #20 | Exceptional 66.5% |
| Immigrants | Hong Kong | 100.0 /100 | #21 | Exceptional 66.4% |
| Soviet Union | 100.0 /100 | #22 | Exceptional 66.4% |
| Immigrants | China | 100.0 /100 | #23 | Exceptional 66.4% |
| Immigrants | Belgium | 100.0 /100 | #24 | Exceptional 66.3% |
| Indians (Asian) | 100.0 /100 | #25 | Exceptional 66.1% |
| Latvians | 100.0 /100 | #26 | Exceptional 66.1% |
| Immigrants | Ireland | 100.0 /100 | #27 | Exceptional 65.9% |
| Immigrants | France | 100.0 /100 | #28 | Exceptional 65.8% |
| Immigrants | Northern Europe | 100.0 /100 | #29 | Exceptional 65.6% |
| Immigrants | Denmark | 100.0 /100 | #30 | Exceptional 65.6% |
| Turks | 100.0 /100 | #31 | Exceptional 65.5% |
Demographics Similar to Native Hawaiians by College, 1 year or more
In terms of college, 1 year or more, the demographic groups most similar to Native Hawaiians are Immigrants from Panama (57.6%, a difference of 0.0%), White/Caucasian (57.6%, a difference of 0.060%), Immigrants from Costa Rica (57.5%, a difference of 0.18%), Immigrants from Peru (57.7%, a difference of 0.24%), and Immigrants from Ghana (57.4%, a difference of 0.25%).
| Demographics | Rating | Rank | College, 1 year or more |
| Immigrants | Nigeria | 13.3 /100 | #211 | Poor 57.9% |
| Immigrants | Senegal | 11.8 /100 | #212 | Poor 57.8% |
| French Canadians | 11.8 /100 | #213 | Poor 57.8% |
| Immigrants | Colombia | 11.6 /100 | #214 | Poor 57.8% |
| Tongans | 11.6 /100 | #215 | Poor 57.8% |
| Immigrants | Peru | 10.6 /100 | #216 | Poor 57.7% |
| Immigrants | Panama | 9.1 /100 | #217 | Tragic 57.6% |
| Native Hawaiians | 9.0 /100 | #218 | Tragic 57.6% |
| Whites/Caucasians | 8.7 /100 | #219 | Tragic 57.6% |
| Immigrants | Costa Rica | 8.0 /100 | #220 | Tragic 57.5% |
| Immigrants | Ghana | 7.7 /100 | #221 | Tragic 57.4% |
| Sub-Saharan Africans | 6.1 /100 | #222 | Tragic 57.3% |
| Portuguese | 5.4 /100 | #223 | Tragic 57.2% |
| Hmong | 5.4 /100 | #224 | Tragic 57.2% |
| Vietnamese | 4.7 /100 | #225 | Tragic 57.0% |