Immigrants from Belgium vs Immigrants from Poland 1st Grade
COMPARE
Immigrants from Belgium
Immigrants from Poland
1st Grade
1st Grade Comparison
Immigrants from Belgium
Immigrants from Poland
98.3%
1ST GRADE
99.2/ 100
METRIC RATING
78th/ 347
METRIC RANK
97.9%
1ST GRADE
40.1/ 100
METRIC RATING
184th/ 347
METRIC RANK
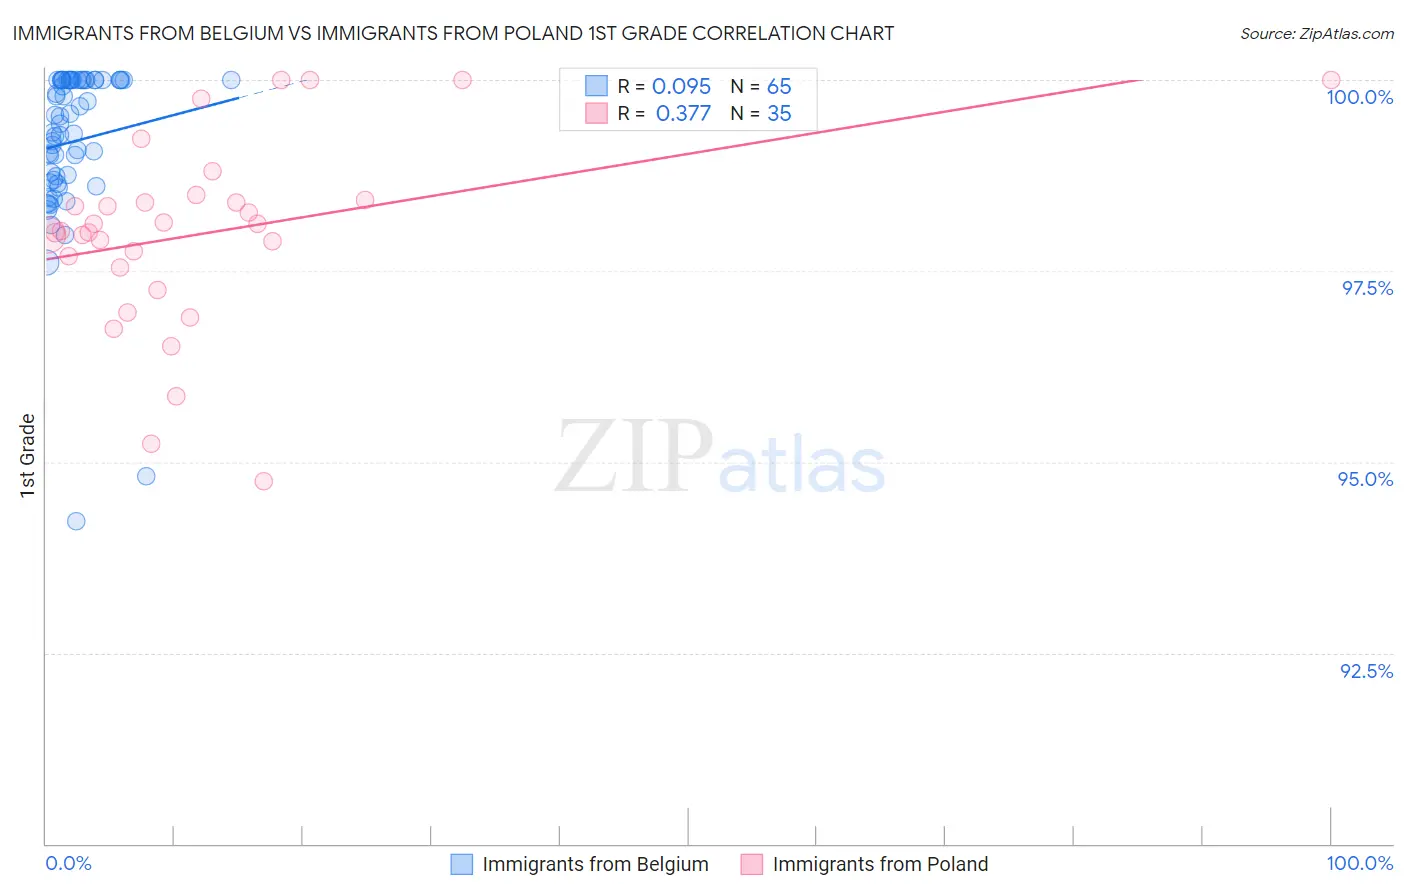
Immigrants from Belgium vs Immigrants from Poland 1st Grade Correlation Chart
The statistical analysis conducted on geographies consisting of 146,727,969 people shows a slight positive correlation between the proportion of Immigrants from Belgium and percentage of population with at least 1st grade education in the United States with a correlation coefficient (R) of 0.095 and weighted average of 98.3%. Similarly, the statistical analysis conducted on geographies consisting of 304,861,559 people shows a mild positive correlation between the proportion of Immigrants from Poland and percentage of population with at least 1st grade education in the United States with a correlation coefficient (R) of 0.377 and weighted average of 97.9%, a difference of 0.41%.
1st Grade Correlation Summary
| Measurement | Immigrants from Belgium | Immigrants from Poland |
| Minimum | 94.2% | 94.8% |
| Maximum | 100.0% | 100.0% |
| Range | 5.8% | 5.2% |
| Mean | 99.2% | 98.0% |
| Median | 99.4% | 98.0% |
| Interquartile 25% (IQ1) | 98.7% | 97.5% |
| Interquartile 75% (IQ3) | 100.0% | 98.4% |
| Interquartile Range (IQR) | 1.3% | 0.89% |
| Standard Deviation (Sample) | 1.1% | 1.2% |
| Standard Deviation (Population) | 1.1% | 1.2% |
Similar Demographics by 1st Grade
Demographics Similar to Immigrants from Belgium by 1st Grade
In terms of 1st grade, the demographic groups most similar to Immigrants from Belgium are Immigrants from Netherlands (98.3%, a difference of 0.010%), Cherokee (98.3%, a difference of 0.010%), Shoshone (98.3%, a difference of 0.010%), Immigrants from England (98.3%, a difference of 0.010%), and Immigrants from Lithuania (98.3%, a difference of 0.010%).
| Demographics | Rating | Rank | 1st Grade |
| Serbians | 99.6 /100 | #71 | Exceptional 98.3% |
| Cheyenne | 99.6 /100 | #72 | Exceptional 98.3% |
| Cajuns | 99.5 /100 | #73 | Exceptional 98.3% |
| Immigrants | Netherlands | 99.4 /100 | #74 | Exceptional 98.3% |
| Cherokee | 99.3 /100 | #75 | Exceptional 98.3% |
| Shoshone | 99.3 /100 | #76 | Exceptional 98.3% |
| Immigrants | England | 99.3 /100 | #77 | Exceptional 98.3% |
| Immigrants | Belgium | 99.2 /100 | #78 | Exceptional 98.3% |
| Immigrants | Lithuania | 99.2 /100 | #79 | Exceptional 98.3% |
| Osage | 99.2 /100 | #80 | Exceptional 98.3% |
| Potawatomi | 99.1 /100 | #81 | Exceptional 98.3% |
| Icelanders | 99.1 /100 | #82 | Exceptional 98.3% |
| Immigrants | Sweden | 99.1 /100 | #83 | Exceptional 98.3% |
| Delaware | 99.1 /100 | #84 | Exceptional 98.3% |
| Hopi | 99.0 /100 | #85 | Exceptional 98.3% |
Demographics Similar to Immigrants from Poland by 1st Grade
In terms of 1st grade, the demographic groups most similar to Immigrants from Poland are Immigrants from Argentina (97.9%, a difference of 0.0%), Immigrants from Belarus (97.9%, a difference of 0.0%), Portuguese (97.9%, a difference of 0.010%), Egyptian (97.9%, a difference of 0.010%), and Paiute (97.9%, a difference of 0.010%).
| Demographics | Rating | Rank | 1st Grade |
| Immigrants | Brazil | 49.1 /100 | #177 | Average 97.9% |
| Immigrants | Venezuela | 47.8 /100 | #178 | Average 97.9% |
| Argentineans | 47.2 /100 | #179 | Average 97.9% |
| Immigrants | Bosnia and Herzegovina | 46.6 /100 | #180 | Average 97.9% |
| Portuguese | 44.2 /100 | #181 | Average 97.9% |
| Egyptians | 42.7 /100 | #182 | Average 97.9% |
| Immigrants | Argentina | 41.3 /100 | #183 | Average 97.9% |
| Immigrants | Poland | 40.1 /100 | #184 | Average 97.9% |
| Immigrants | Belarus | 39.3 /100 | #185 | Fair 97.9% |
| Paiute | 36.5 /100 | #186 | Fair 97.9% |
| Pakistanis | 35.8 /100 | #187 | Fair 97.9% |
| Arabs | 35.5 /100 | #188 | Fair 97.9% |
| Immigrants | Kazakhstan | 34.9 /100 | #189 | Fair 97.9% |
| Panamanians | 34.1 /100 | #190 | Fair 97.9% |
| Blacks/African Americans | 30.7 /100 | #191 | Fair 97.9% |