Immigrants from Barbados vs Immigrants from Uruguay College, 1 year or more
COMPARE
Immigrants from Barbados
Immigrants from Uruguay
College, 1 year or more
College, 1 year or more Comparison
Immigrants from Barbados
Immigrants from Uruguay
55.4%
COLLEGE, 1 YEAR OR MORE
0.6/ 100
METRIC RATING
253rd/ 347
METRIC RANK
58.1%
COLLEGE, 1 YEAR OR MORE
15.2/ 100
METRIC RATING
208th/ 347
METRIC RANK
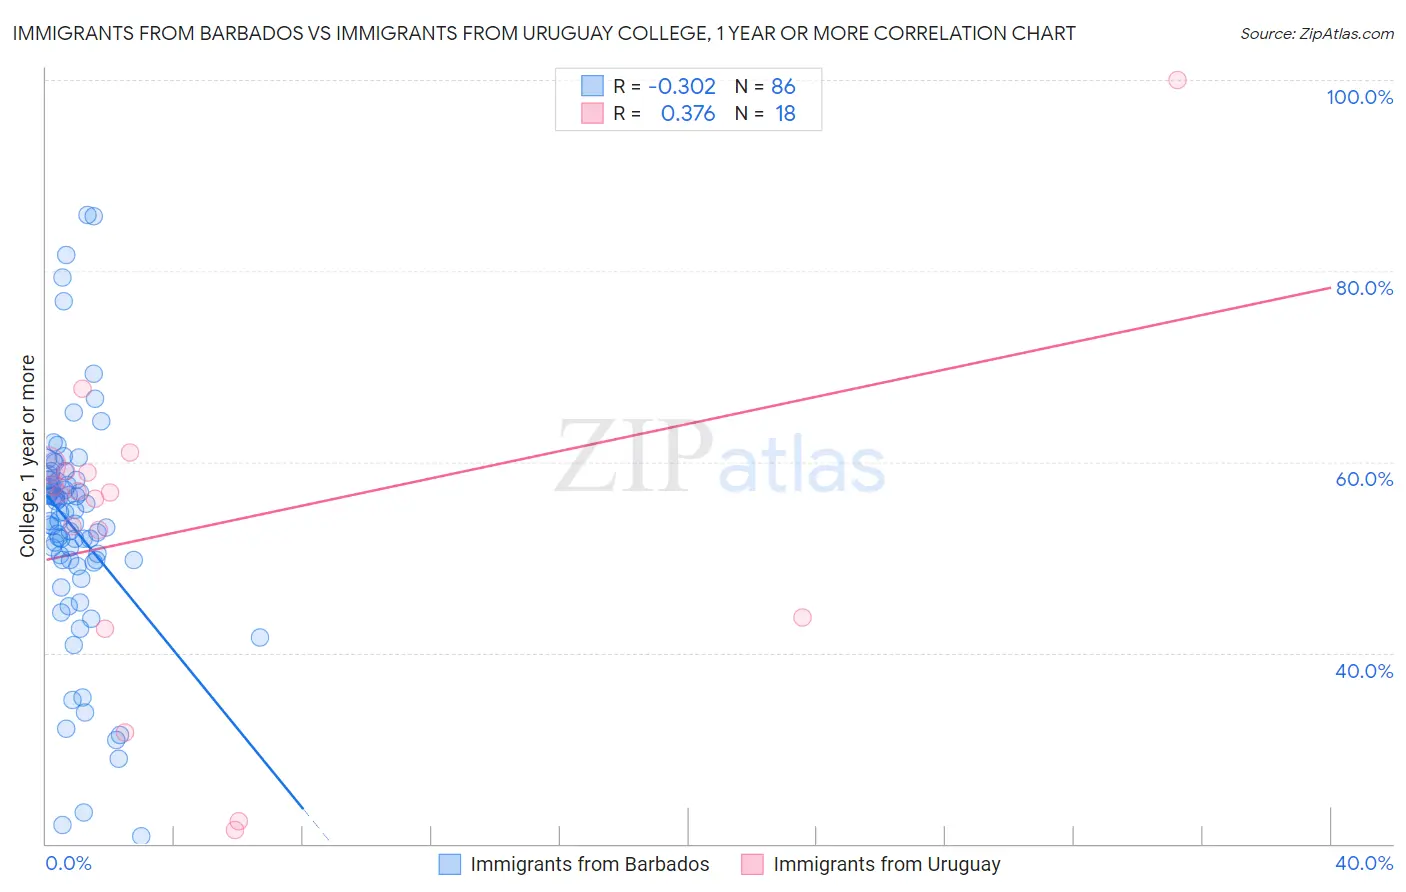
Immigrants from Barbados vs Immigrants from Uruguay College, 1 year or more Correlation Chart
The statistical analysis conducted on geographies consisting of 112,783,541 people shows a mild negative correlation between the proportion of Immigrants from Barbados and percentage of population with at least college, 1 year or more education in the United States with a correlation coefficient (R) of -0.302 and weighted average of 55.4%. Similarly, the statistical analysis conducted on geographies consisting of 133,259,667 people shows a mild positive correlation between the proportion of Immigrants from Uruguay and percentage of population with at least college, 1 year or more education in the United States with a correlation coefficient (R) of 0.376 and weighted average of 58.1%, a difference of 4.9%.
College, 1 year or more Correlation Summary
| Measurement | Immigrants from Barbados | Immigrants from Uruguay |
| Minimum | 20.7% | 21.5% |
| Maximum | 85.8% | 100.0% |
| Range | 65.1% | 78.5% |
| Mean | 53.0% | 53.2% |
| Median | 53.8% | 56.7% |
| Interquartile 25% (IQ1) | 49.7% | 43.8% |
| Interquartile 75% (IQ3) | 58.1% | 59.1% |
| Interquartile Range (IQR) | 8.4% | 15.3% |
| Standard Deviation (Sample) | 12.1% | 17.6% |
| Standard Deviation (Population) | 12.1% | 17.1% |
Similar Demographics by College, 1 year or more
Demographics Similar to Immigrants from Barbados by College, 1 year or more
In terms of college, 1 year or more, the demographic groups most similar to Immigrants from Barbados are Aleut (55.4%, a difference of 0.11%), Immigrants from Cambodia (55.4%, a difference of 0.13%), Delaware (55.5%, a difference of 0.23%), Immigrants from Trinidad and Tobago (55.5%, a difference of 0.25%), and Japanese (55.2%, a difference of 0.25%).
| Demographics | Rating | Rank | College, 1 year or more |
| Malaysians | 0.8 /100 | #246 | Tragic 55.6% |
| Hawaiians | 0.8 /100 | #247 | Tragic 55.6% |
| Immigrants | Congo | 0.8 /100 | #248 | Tragic 55.6% |
| Immigrants | Trinidad and Tobago | 0.7 /100 | #249 | Tragic 55.5% |
| Delaware | 0.7 /100 | #250 | Tragic 55.5% |
| Immigrants | Cambodia | 0.6 /100 | #251 | Tragic 55.4% |
| Aleuts | 0.6 /100 | #252 | Tragic 55.4% |
| Immigrants | Barbados | 0.6 /100 | #253 | Tragic 55.4% |
| Japanese | 0.5 /100 | #254 | Tragic 55.2% |
| Immigrants | Bahamas | 0.5 /100 | #255 | Tragic 55.2% |
| Immigrants | West Indies | 0.5 /100 | #256 | Tragic 55.2% |
| Indonesians | 0.4 /100 | #257 | Tragic 55.1% |
| Africans | 0.4 /100 | #258 | Tragic 55.0% |
| Nepalese | 0.3 /100 | #259 | Tragic 54.9% |
| Jamaicans | 0.3 /100 | #260 | Tragic 54.9% |
Demographics Similar to Immigrants from Uruguay by College, 1 year or more
In terms of college, 1 year or more, the demographic groups most similar to Immigrants from Uruguay are Immigrants from Middle Africa (58.0%, a difference of 0.13%), Senegalese (58.2%, a difference of 0.17%), Tsimshian (57.9%, a difference of 0.19%), Immigrants from Nigeria (57.9%, a difference of 0.22%), and Immigrants from Vietnam (58.2%, a difference of 0.29%).
| Demographics | Rating | Rank | College, 1 year or more |
| Nigerians | 23.0 /100 | #201 | Fair 58.5% |
| Immigrants | South America | 21.9 /100 | #202 | Fair 58.4% |
| Ghanaians | 20.9 /100 | #203 | Fair 58.4% |
| Panamanians | 19.2 /100 | #204 | Poor 58.3% |
| Immigrants | Zaire | 18.7 /100 | #205 | Poor 58.3% |
| Immigrants | Vietnam | 18.2 /100 | #206 | Poor 58.2% |
| Senegalese | 16.9 /100 | #207 | Poor 58.2% |
| Immigrants | Uruguay | 15.2 /100 | #208 | Poor 58.1% |
| Immigrants | Middle Africa | 14.0 /100 | #209 | Poor 58.0% |
| Tsimshian | 13.5 /100 | #210 | Poor 57.9% |
| Immigrants | Nigeria | 13.3 /100 | #211 | Poor 57.9% |
| Immigrants | Senegal | 11.8 /100 | #212 | Poor 57.8% |
| French Canadians | 11.8 /100 | #213 | Poor 57.8% |
| Immigrants | Colombia | 11.6 /100 | #214 | Poor 57.8% |
| Tongans | 11.6 /100 | #215 | Poor 57.8% |