Immigrants from Barbados vs Peruvian College, 1 year or more
COMPARE
Immigrants from Barbados
Peruvian
College, 1 year or more
College, 1 year or more Comparison
Immigrants from Barbados
Peruvians
55.4%
COLLEGE, 1 YEAR OR MORE
0.6/ 100
METRIC RATING
253rd/ 347
METRIC RANK
58.6%
COLLEGE, 1 YEAR OR MORE
27.5/ 100
METRIC RATING
193rd/ 347
METRIC RANK
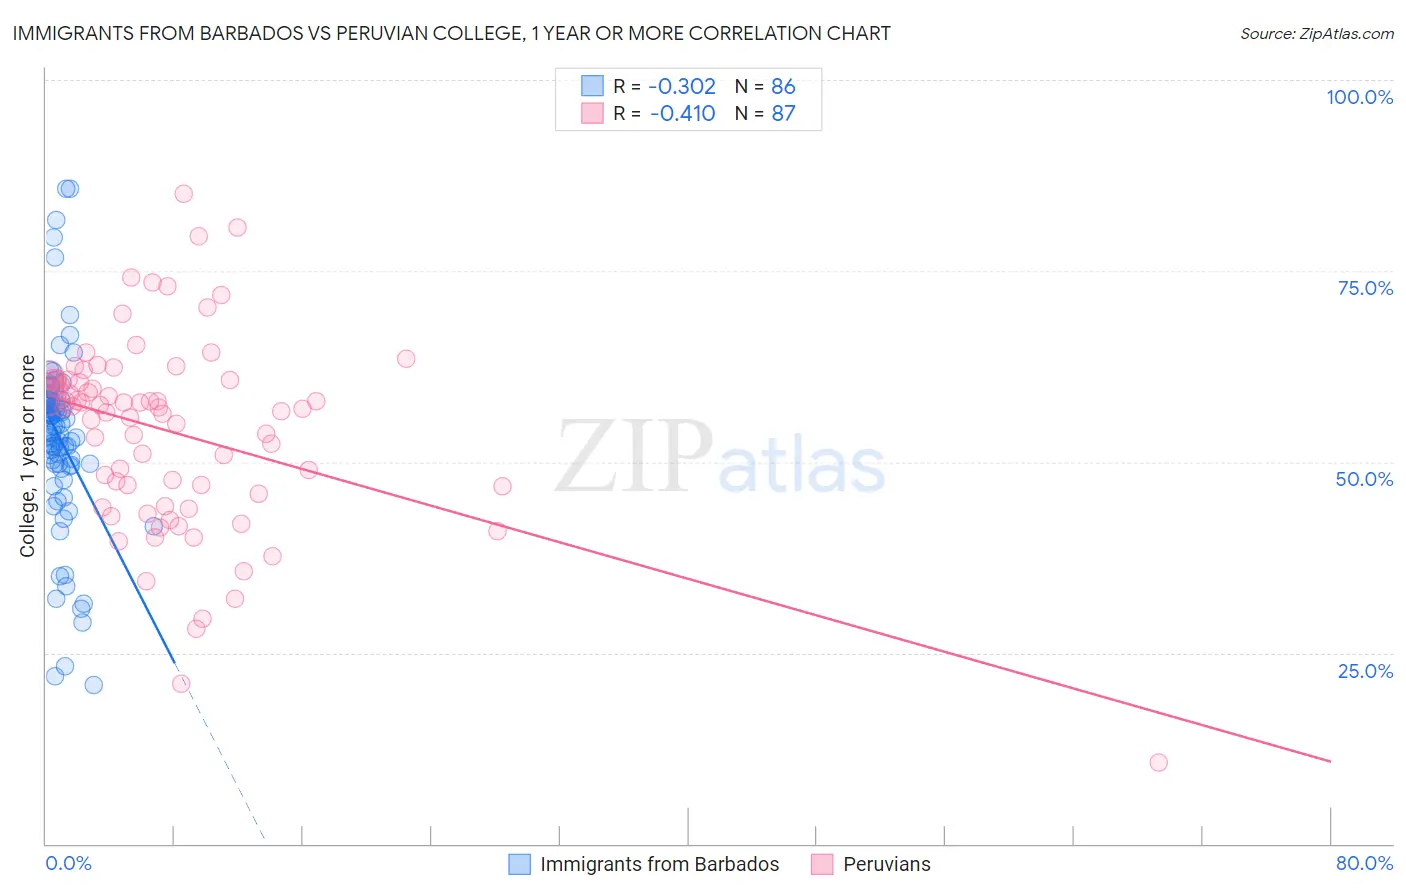
Immigrants from Barbados vs Peruvian College, 1 year or more Correlation Chart
The statistical analysis conducted on geographies consisting of 112,783,541 people shows a mild negative correlation between the proportion of Immigrants from Barbados and percentage of population with at least college, 1 year or more education in the United States with a correlation coefficient (R) of -0.302 and weighted average of 55.4%. Similarly, the statistical analysis conducted on geographies consisting of 363,249,143 people shows a moderate negative correlation between the proportion of Peruvians and percentage of population with at least college, 1 year or more education in the United States with a correlation coefficient (R) of -0.410 and weighted average of 58.6%, a difference of 5.9%.
College, 1 year or more Correlation Summary
| Measurement | Immigrants from Barbados | Peruvian |
| Minimum | 20.7% | 10.6% |
| Maximum | 85.8% | 85.1% |
| Range | 65.1% | 74.5% |
| Mean | 53.0% | 53.9% |
| Median | 53.8% | 57.1% |
| Interquartile 25% (IQ1) | 49.7% | 45.8% |
| Interquartile 75% (IQ3) | 58.1% | 60.7% |
| Interquartile Range (IQR) | 8.4% | 14.9% |
| Standard Deviation (Sample) | 12.1% | 12.7% |
| Standard Deviation (Population) | 12.1% | 12.6% |
Similar Demographics by College, 1 year or more
Demographics Similar to Immigrants from Barbados by College, 1 year or more
In terms of college, 1 year or more, the demographic groups most similar to Immigrants from Barbados are Aleut (55.4%, a difference of 0.11%), Immigrants from Cambodia (55.4%, a difference of 0.13%), Delaware (55.5%, a difference of 0.23%), Immigrants from Trinidad and Tobago (55.5%, a difference of 0.25%), and Japanese (55.2%, a difference of 0.25%).
| Demographics | Rating | Rank | College, 1 year or more |
| Malaysians | 0.8 /100 | #246 | Tragic 55.6% |
| Hawaiians | 0.8 /100 | #247 | Tragic 55.6% |
| Immigrants | Congo | 0.8 /100 | #248 | Tragic 55.6% |
| Immigrants | Trinidad and Tobago | 0.7 /100 | #249 | Tragic 55.5% |
| Delaware | 0.7 /100 | #250 | Tragic 55.5% |
| Immigrants | Cambodia | 0.6 /100 | #251 | Tragic 55.4% |
| Aleuts | 0.6 /100 | #252 | Tragic 55.4% |
| Immigrants | Barbados | 0.6 /100 | #253 | Tragic 55.4% |
| Japanese | 0.5 /100 | #254 | Tragic 55.2% |
| Immigrants | Bahamas | 0.5 /100 | #255 | Tragic 55.2% |
| Immigrants | West Indies | 0.5 /100 | #256 | Tragic 55.2% |
| Indonesians | 0.4 /100 | #257 | Tragic 55.1% |
| Africans | 0.4 /100 | #258 | Tragic 55.0% |
| Nepalese | 0.3 /100 | #259 | Tragic 54.9% |
| Jamaicans | 0.3 /100 | #260 | Tragic 54.9% |
Demographics Similar to Peruvians by College, 1 year or more
In terms of college, 1 year or more, the demographic groups most similar to Peruvians are Colombian (58.7%, a difference of 0.010%), Costa Rican (58.6%, a difference of 0.070%), Dutch (58.6%, a difference of 0.090%), Guamanian/Chamorro (58.6%, a difference of 0.090%), and Immigrants from Thailand (58.6%, a difference of 0.10%).
| Demographics | Rating | Rank | College, 1 year or more |
| Scotch-Irish | 34.7 /100 | #186 | Fair 58.9% |
| Germans | 34.7 /100 | #187 | Fair 58.9% |
| French | 34.4 /100 | #188 | Fair 58.9% |
| Uruguayans | 31.8 /100 | #189 | Fair 58.8% |
| Immigrants | Cameroon | 31.2 /100 | #190 | Fair 58.8% |
| Immigrants | Philippines | 29.2 /100 | #191 | Fair 58.7% |
| Colombians | 27.6 /100 | #192 | Fair 58.7% |
| Peruvians | 27.5 /100 | #193 | Fair 58.6% |
| Costa Ricans | 26.4 /100 | #194 | Fair 58.6% |
| Dutch | 26.2 /100 | #195 | Fair 58.6% |
| Guamanians/Chamorros | 26.2 /100 | #196 | Fair 58.6% |
| Immigrants | Thailand | 26.0 /100 | #197 | Fair 58.6% |
| Immigrants | South Eastern Asia | 25.1 /100 | #198 | Fair 58.5% |
| Slovaks | 24.6 /100 | #199 | Fair 58.5% |
| Spanish | 24.2 /100 | #200 | Fair 58.5% |