Immigrants from Bahamas vs Trinidadian and Tobagonian Male Unemployment
COMPARE
Immigrants from Bahamas
Trinidadian and Tobagonian
Male Unemployment
Male Unemployment Comparison
Immigrants from Bahamas
Trinidadians and Tobagonians
5.7%
MALE UNEMPLOYMENT
0.4/ 100
METRIC RATING
250th/ 347
METRIC RANK
6.7%
MALE UNEMPLOYMENT
0.0/ 100
METRIC RATING
305th/ 347
METRIC RANK
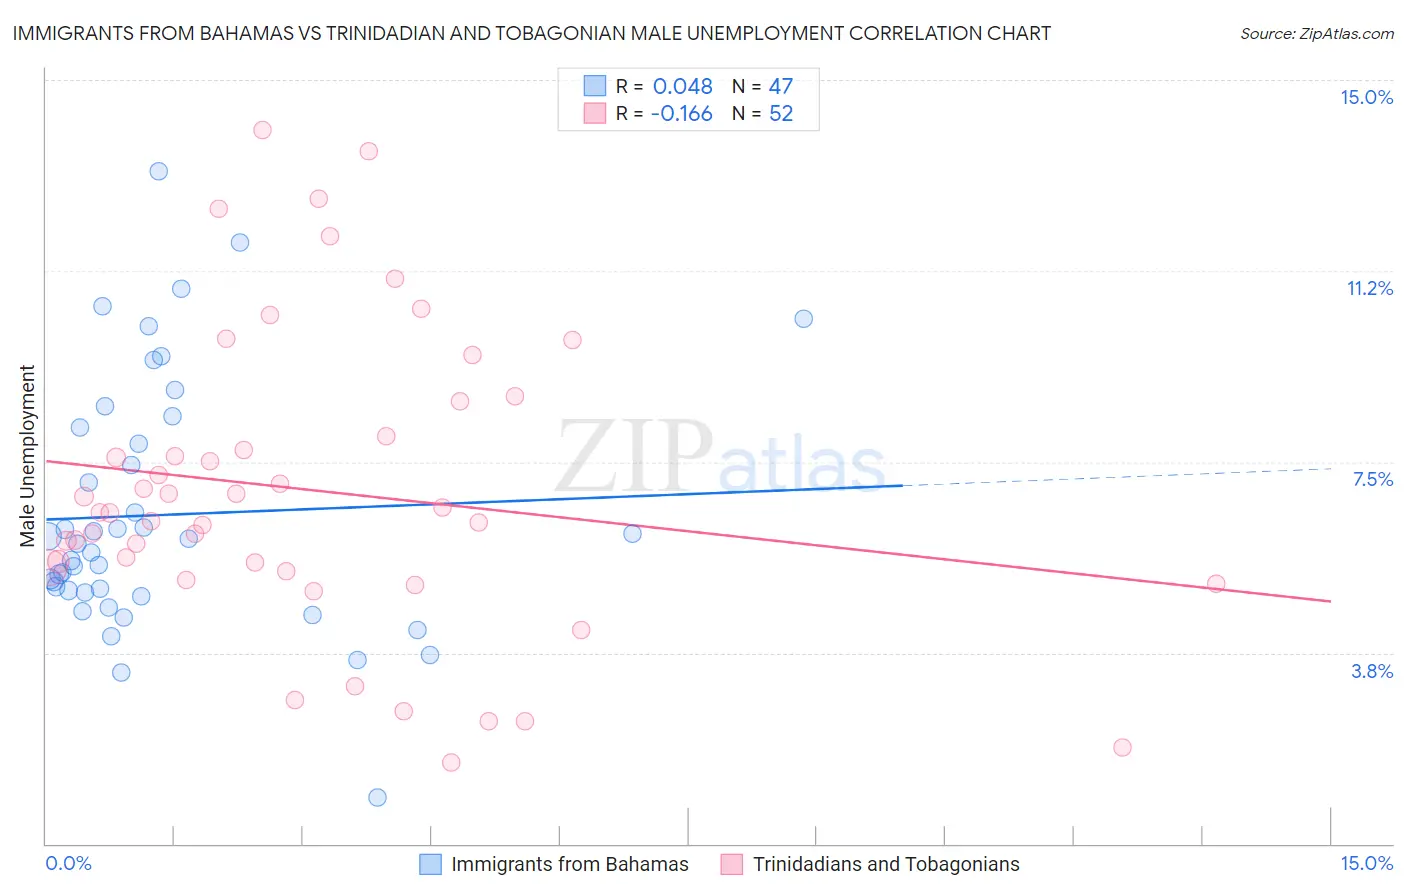
Immigrants from Bahamas vs Trinidadian and Tobagonian Male Unemployment Correlation Chart
The statistical analysis conducted on geographies consisting of 104,587,349 people shows no correlation between the proportion of Immigrants from Bahamas and unemployment rate among males in the United States with a correlation coefficient (R) of 0.048 and weighted average of 5.7%. Similarly, the statistical analysis conducted on geographies consisting of 219,443,650 people shows a poor negative correlation between the proportion of Trinidadians and Tobagonians and unemployment rate among males in the United States with a correlation coefficient (R) of -0.166 and weighted average of 6.7%, a difference of 16.6%.
Male Unemployment Correlation Summary
| Measurement | Immigrants from Bahamas | Trinidadian and Tobagonian |
| Minimum | 0.90% | 1.6% |
| Maximum | 13.2% | 14.0% |
| Range | 12.3% | 12.4% |
| Mean | 6.5% | 6.9% |
| Median | 5.9% | 6.5% |
| Interquartile 25% (IQ1) | 4.9% | 5.4% |
| Interquartile 75% (IQ3) | 8.2% | 8.4% |
| Interquartile Range (IQR) | 3.2% | 3.0% |
| Standard Deviation (Sample) | 2.5% | 2.9% |
| Standard Deviation (Population) | 2.4% | 2.9% |
Similar Demographics by Male Unemployment
Demographics Similar to Immigrants from Bahamas by Male Unemployment
In terms of male unemployment, the demographic groups most similar to Immigrants from Bahamas are Spanish American (5.7%, a difference of 0.040%), Cree (5.7%, a difference of 0.24%), Marshallese (5.7%, a difference of 0.31%), Mexican (5.8%, a difference of 0.62%), and Hawaiian (5.7%, a difference of 0.63%).
| Demographics | Rating | Rank | Male Unemployment |
| Bangladeshis | 0.8 /100 | #243 | Tragic 5.7% |
| Immigrants | El Salvador | 0.7 /100 | #244 | Tragic 5.7% |
| Yaqui | 0.7 /100 | #245 | Tragic 5.7% |
| Iroquois | 0.6 /100 | #246 | Tragic 5.7% |
| Hawaiians | 0.6 /100 | #247 | Tragic 5.7% |
| Marshallese | 0.5 /100 | #248 | Tragic 5.7% |
| Cree | 0.4 /100 | #249 | Tragic 5.7% |
| Immigrants | Bahamas | 0.4 /100 | #250 | Tragic 5.7% |
| Spanish Americans | 0.3 /100 | #251 | Tragic 5.7% |
| Mexicans | 0.2 /100 | #252 | Tragic 5.8% |
| Mexican American Indians | 0.2 /100 | #253 | Tragic 5.8% |
| Japanese | 0.2 /100 | #254 | Tragic 5.8% |
| Kiowa | 0.2 /100 | #255 | Tragic 5.8% |
| Comanche | 0.2 /100 | #256 | Tragic 5.8% |
| Hispanics or Latinos | 0.1 /100 | #257 | Tragic 5.8% |
Demographics Similar to Trinidadians and Tobagonians by Male Unemployment
In terms of male unemployment, the demographic groups most similar to Trinidadians and Tobagonians are Immigrants from Trinidad and Tobago (6.7%, a difference of 0.20%), Immigrants from Jamaica (6.7%, a difference of 0.28%), Immigrants from West Indies (6.7%, a difference of 0.32%), West Indian (6.7%, a difference of 0.32%), and Ute (6.6%, a difference of 0.69%).
| Demographics | Rating | Rank | Male Unemployment |
| Jamaicans | 0.0 /100 | #298 | Tragic 6.6% |
| Immigrants | Bangladesh | 0.0 /100 | #299 | Tragic 6.6% |
| Vietnamese | 0.0 /100 | #300 | Tragic 6.6% |
| Immigrants | Belize | 0.0 /100 | #301 | Tragic 6.6% |
| Ute | 0.0 /100 | #302 | Tragic 6.6% |
| Immigrants | West Indies | 0.0 /100 | #303 | Tragic 6.7% |
| West Indians | 0.0 /100 | #304 | Tragic 6.7% |
| Trinidadians and Tobagonians | 0.0 /100 | #305 | Tragic 6.7% |
| Immigrants | Trinidad and Tobago | 0.0 /100 | #306 | Tragic 6.7% |
| Immigrants | Jamaica | 0.0 /100 | #307 | Tragic 6.7% |
| Aleuts | 0.0 /100 | #308 | Tragic 6.8% |
| Barbadians | 0.0 /100 | #309 | Tragic 6.9% |
| Blacks/African Americans | 0.0 /100 | #310 | Tragic 6.9% |
| Immigrants | Armenia | 0.0 /100 | #311 | Tragic 6.9% |
| Lumbee | 0.0 /100 | #312 | Tragic 6.9% |