Immigrants from Bahamas vs Shoshone Unemployment Among Ages 16 to 19 years
COMPARE
Immigrants from Bahamas
Shoshone
Unemployment Among Ages 16 to 19 years
Unemployment Among Ages 16 to 19 years Comparison
Immigrants from Bahamas
Shoshone
20.4%
UNEMPLOYMENT AMONG AGES 16 TO 19 YEARS
0.0/ 100
METRIC RATING
293rd/ 347
METRIC RANK
19.3%
UNEMPLOYMENT AMONG AGES 16 TO 19 YEARS
0.0/ 100
METRIC RATING
274th/ 347
METRIC RANK
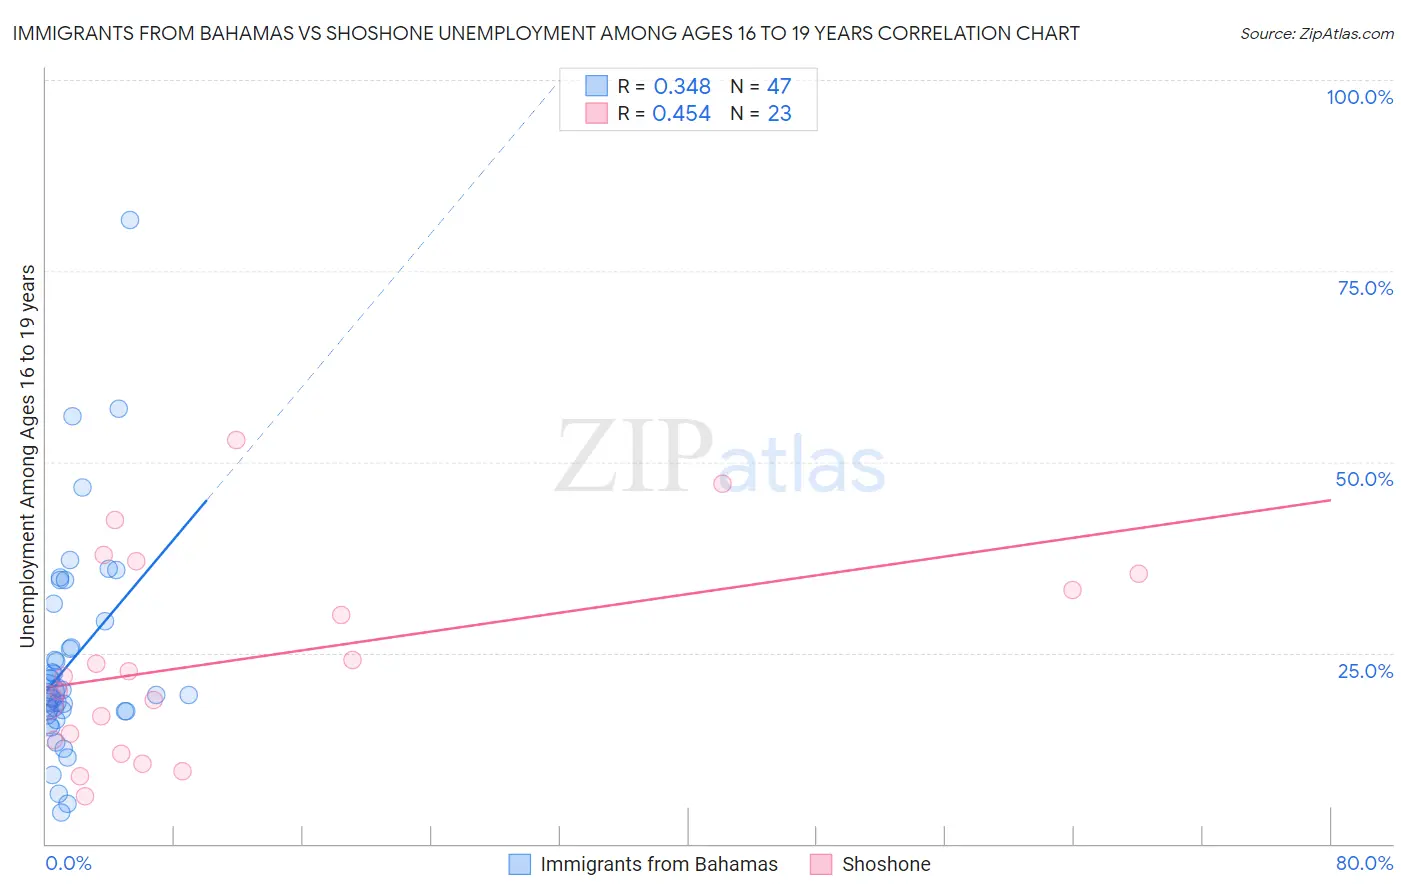
Immigrants from Bahamas vs Shoshone Unemployment Among Ages 16 to 19 years Correlation Chart
The statistical analysis conducted on geographies consisting of 102,900,667 people shows a mild positive correlation between the proportion of Immigrants from Bahamas and unemployment rate among population between the ages 16 and 19 in the United States with a correlation coefficient (R) of 0.348 and weighted average of 20.4%. Similarly, the statistical analysis conducted on geographies consisting of 65,748,510 people shows a moderate positive correlation between the proportion of Shoshone and unemployment rate among population between the ages 16 and 19 in the United States with a correlation coefficient (R) of 0.454 and weighted average of 19.3%, a difference of 5.6%.
Unemployment Among Ages 16 to 19 years Correlation Summary
| Measurement | Immigrants from Bahamas | Shoshone |
| Minimum | 4.1% | 6.2% |
| Maximum | 81.7% | 52.9% |
| Range | 77.6% | 46.7% |
| Mean | 24.0% | 24.2% |
| Median | 19.8% | 22.0% |
| Interquartile 25% (IQ1) | 17.3% | 13.6% |
| Interquartile 75% (IQ3) | 29.2% | 35.3% |
| Interquartile Range (IQR) | 11.9% | 21.7% |
| Standard Deviation (Sample) | 14.2% | 13.0% |
| Standard Deviation (Population) | 14.0% | 12.7% |
Demographics Similar to Immigrants from Bahamas and Shoshone by Unemployment Among Ages 16 to 19 years
In terms of unemployment among ages 16 to 19 years, the demographic groups most similar to Immigrants from Bahamas are Comanche (20.2%, a difference of 0.63%), Immigrants from Yemen (20.0%, a difference of 1.7%), Immigrants from Sierra Leone (20.0%, a difference of 2.1%), Pueblo (19.8%, a difference of 2.7%), and Immigrants from the Azores (19.8%, a difference of 2.8%). Similarly, the demographic groups most similar to Shoshone are Immigrants from Panama (19.3%, a difference of 0.15%), Paraguayan (19.4%, a difference of 0.33%), Immigrants from Latin America (19.4%, a difference of 0.42%), Immigrants from Western Africa (19.4%, a difference of 0.75%), and African (19.5%, a difference of 0.98%).
| Demographics | Rating | Rank | Unemployment Among Ages 16 to 19 years |
| Immigrants | Panama | 0.0 /100 | #273 | Tragic 19.3% |
| Shoshone | 0.0 /100 | #274 | Tragic 19.3% |
| Paraguayans | 0.0 /100 | #275 | Tragic 19.4% |
| Immigrants | Latin America | 0.0 /100 | #276 | Tragic 19.4% |
| Immigrants | Western Africa | 0.0 /100 | #277 | Tragic 19.4% |
| Africans | 0.0 /100 | #278 | Tragic 19.5% |
| Ute | 0.0 /100 | #279 | Tragic 19.6% |
| Cajuns | 0.0 /100 | #280 | Tragic 19.6% |
| Cypriots | 0.0 /100 | #281 | Tragic 19.6% |
| Dutch West Indians | 0.0 /100 | #282 | Tragic 19.7% |
| Sioux | 0.0 /100 | #283 | Tragic 19.7% |
| Sierra Leoneans | 0.0 /100 | #284 | Tragic 19.7% |
| Ghanaians | 0.0 /100 | #285 | Tragic 19.8% |
| Bahamians | 0.0 /100 | #286 | Tragic 19.8% |
| Immigrants | Ghana | 0.0 /100 | #287 | Tragic 19.8% |
| Immigrants | Azores | 0.0 /100 | #288 | Tragic 19.8% |
| Pueblo | 0.0 /100 | #289 | Tragic 19.8% |
| Immigrants | Sierra Leone | 0.0 /100 | #290 | Tragic 20.0% |
| Immigrants | Yemen | 0.0 /100 | #291 | Tragic 20.0% |
| Comanche | 0.0 /100 | #292 | Tragic 20.2% |
| Immigrants | Bahamas | 0.0 /100 | #293 | Tragic 20.4% |