Immigrants from Bahamas vs Slovak Associate's Degree
COMPARE
Immigrants from Bahamas
Slovak
Associate's Degree
Associate's Degree Comparison
Immigrants from Bahamas
Slovaks
42.1%
ASSOCIATE'S DEGREE
0.7/ 100
METRIC RATING
251st/ 347
METRIC RANK
46.3%
ASSOCIATE'S DEGREE
48.4/ 100
METRIC RATING
177th/ 347
METRIC RANK
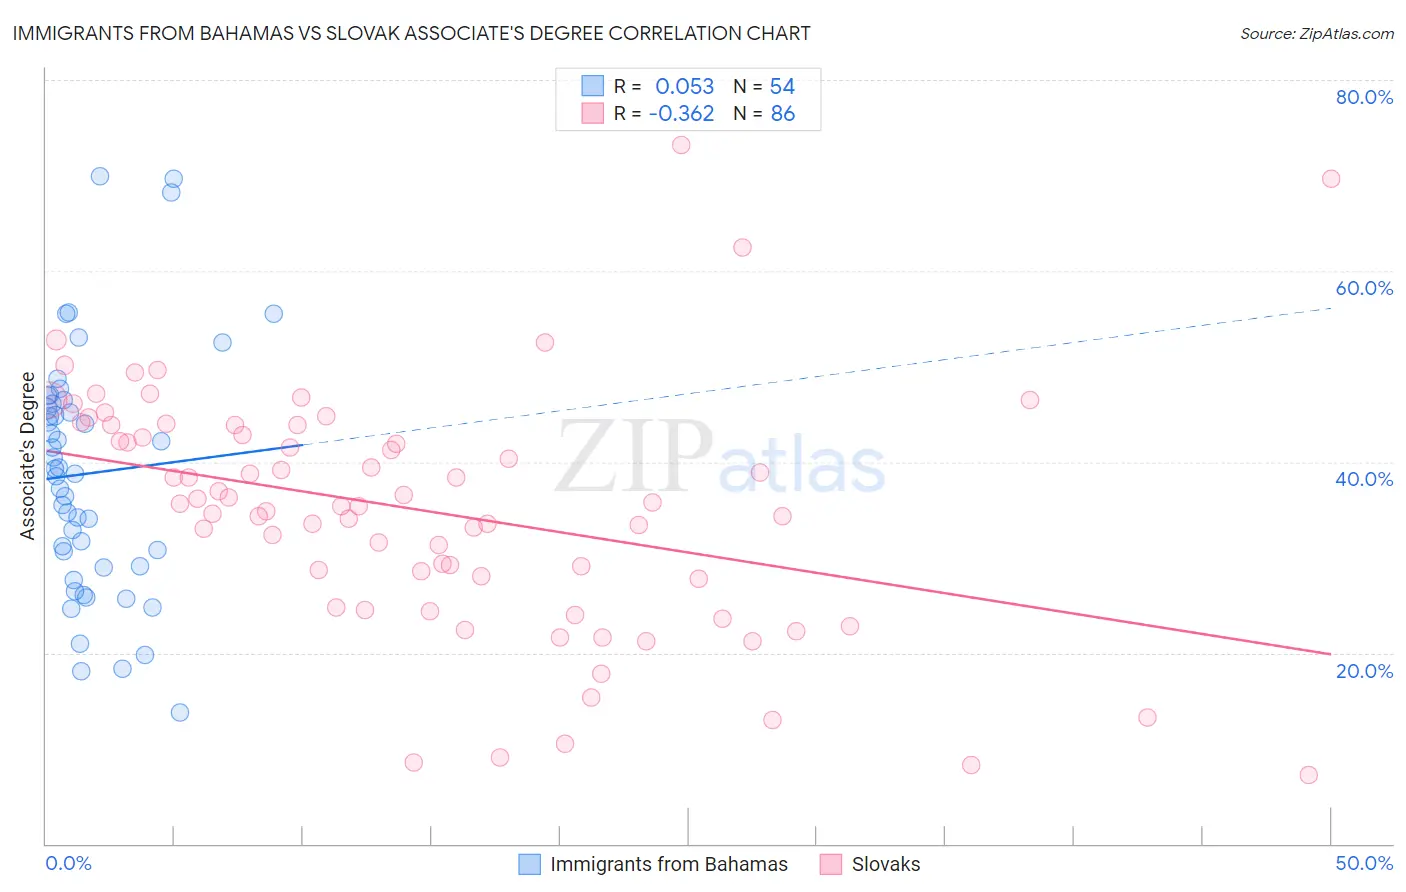
Immigrants from Bahamas vs Slovak Associate's Degree Correlation Chart
The statistical analysis conducted on geographies consisting of 104,664,532 people shows a slight positive correlation between the proportion of Immigrants from Bahamas and percentage of population with at least associate's degree education in the United States with a correlation coefficient (R) of 0.053 and weighted average of 42.1%. Similarly, the statistical analysis conducted on geographies consisting of 397,875,693 people shows a mild negative correlation between the proportion of Slovaks and percentage of population with at least associate's degree education in the United States with a correlation coefficient (R) of -0.362 and weighted average of 46.3%, a difference of 10.0%.
Associate's Degree Correlation Summary
| Measurement | Immigrants from Bahamas | Slovak |
| Minimum | 13.7% | 7.1% |
| Maximum | 69.9% | 73.2% |
| Range | 56.2% | 66.0% |
| Mean | 38.8% | 34.9% |
| Median | 39.0% | 35.4% |
| Interquartile 25% (IQ1) | 29.0% | 27.8% |
| Interquartile 75% (IQ3) | 46.1% | 43.8% |
| Interquartile Range (IQR) | 17.0% | 16.1% |
| Standard Deviation (Sample) | 12.7% | 12.8% |
| Standard Deviation (Population) | 12.6% | 12.7% |
Similar Demographics by Associate's Degree
Demographics Similar to Immigrants from Bahamas by Associate's Degree
In terms of associate's degree, the demographic groups most similar to Immigrants from Bahamas are U.S. Virgin Islander (42.1%, a difference of 0.020%), Jamaican (42.1%, a difference of 0.030%), Immigrants from Ecuador (42.2%, a difference of 0.18%), Immigrants from Fiji (42.2%, a difference of 0.26%), and Delaware (42.3%, a difference of 0.35%).
| Demographics | Rating | Rank | Associate's Degree |
| Immigrants | Liberia | 0.9 /100 | #244 | Tragic 42.3% |
| Immigrants | Cambodia | 0.9 /100 | #245 | Tragic 42.3% |
| Delaware | 0.9 /100 | #246 | Tragic 42.3% |
| Immigrants | Fiji | 0.8 /100 | #247 | Tragic 42.2% |
| Immigrants | Ecuador | 0.8 /100 | #248 | Tragic 42.2% |
| Jamaicans | 0.7 /100 | #249 | Tragic 42.1% |
| U.S. Virgin Islanders | 0.7 /100 | #250 | Tragic 42.1% |
| Immigrants | Bahamas | 0.7 /100 | #251 | Tragic 42.1% |
| French American Indians | 0.6 /100 | #252 | Tragic 42.0% |
| Indonesians | 0.6 /100 | #253 | Tragic 41.9% |
| Cubans | 0.6 /100 | #254 | Tragic 41.9% |
| Immigrants | Guyana | 0.5 /100 | #255 | Tragic 41.8% |
| Immigrants | Congo | 0.5 /100 | #256 | Tragic 41.8% |
| Spanish Americans | 0.5 /100 | #257 | Tragic 41.8% |
| Japanese | 0.5 /100 | #258 | Tragic 41.7% |
Demographics Similar to Slovaks by Associate's Degree
In terms of associate's degree, the demographic groups most similar to Slovaks are Finnish (46.3%, a difference of 0.010%), Immigrants from Bosnia and Herzegovina (46.3%, a difference of 0.010%), Belgian (46.3%, a difference of 0.040%), Sri Lankan (46.3%, a difference of 0.060%), and English (46.4%, a difference of 0.12%).
| Demographics | Rating | Rank | Associate's Degree |
| Irish | 53.6 /100 | #170 | Average 46.5% |
| Basques | 52.8 /100 | #171 | Average 46.5% |
| Peruvians | 50.5 /100 | #172 | Average 46.4% |
| Immigrants | Iraq | 50.3 /100 | #173 | Average 46.4% |
| English | 50.0 /100 | #174 | Average 46.4% |
| Belgians | 48.9 /100 | #175 | Average 46.3% |
| Finns | 48.5 /100 | #176 | Average 46.3% |
| Slovaks | 48.4 /100 | #177 | Average 46.3% |
| Immigrants | Bosnia and Herzegovina | 48.3 /100 | #178 | Average 46.3% |
| Sri Lankans | 47.6 /100 | #179 | Average 46.3% |
| Bermudans | 46.4 /100 | #180 | Average 46.2% |
| Immigrants | Colombia | 41.3 /100 | #181 | Average 46.0% |
| Swiss | 40.4 /100 | #182 | Average 46.0% |
| Yugoslavians | 40.2 /100 | #183 | Average 46.0% |
| Czechoslovakians | 40.0 /100 | #184 | Average 46.0% |