Immigrants from Bahamas vs Sudanese Associate's Degree
COMPARE
Immigrants from Bahamas
Sudanese
Associate's Degree
Associate's Degree Comparison
Immigrants from Bahamas
Sudanese
42.1%
ASSOCIATE'S DEGREE
0.7/ 100
METRIC RATING
251st/ 347
METRIC RANK
47.1%
ASSOCIATE'S DEGREE
70.3/ 100
METRIC RATING
157th/ 347
METRIC RANK
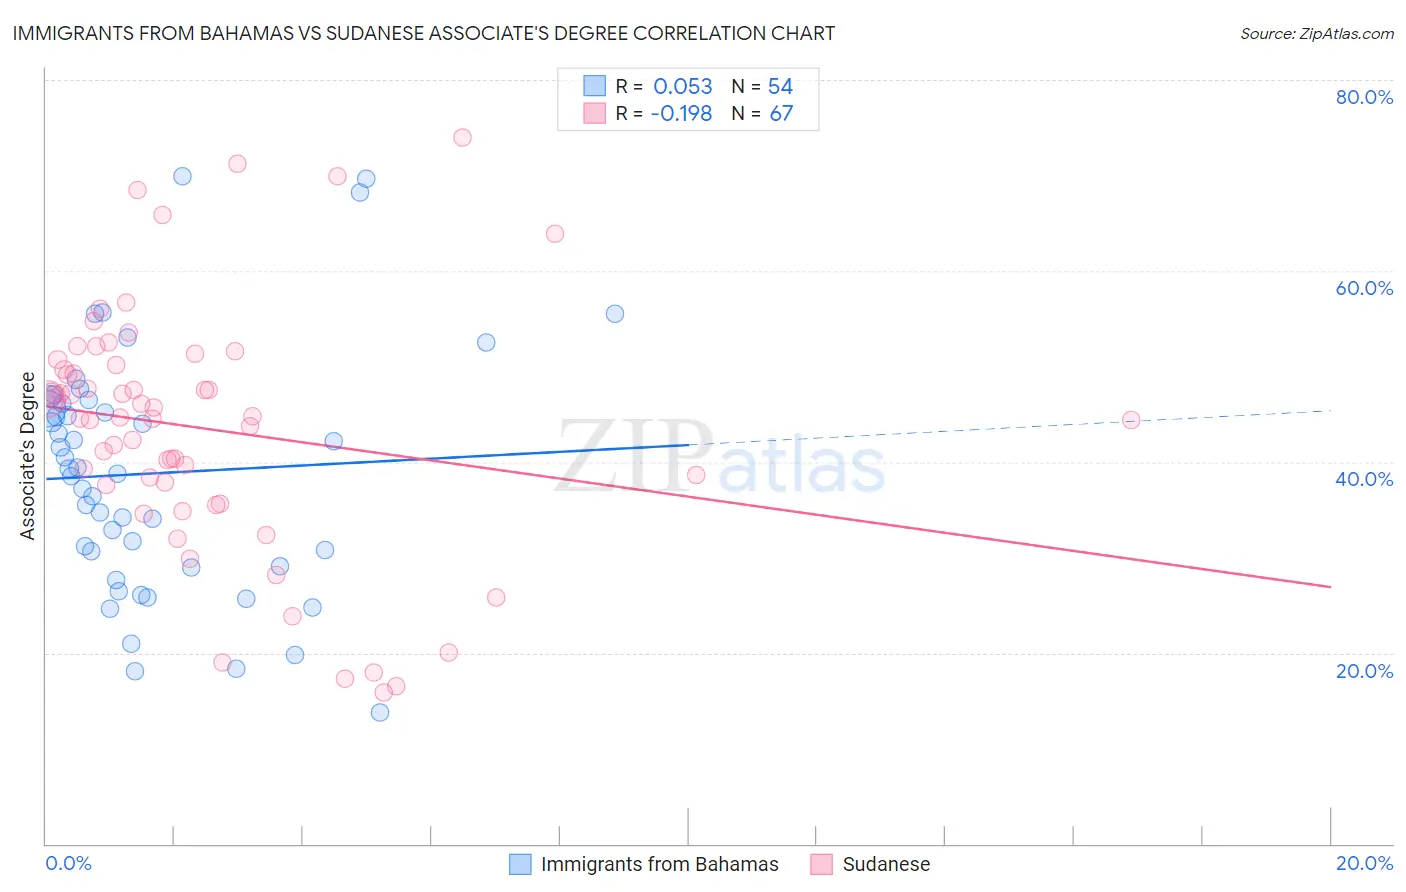
Immigrants from Bahamas vs Sudanese Associate's Degree Correlation Chart
The statistical analysis conducted on geographies consisting of 104,664,532 people shows a slight positive correlation between the proportion of Immigrants from Bahamas and percentage of population with at least associate's degree education in the United States with a correlation coefficient (R) of 0.053 and weighted average of 42.1%. Similarly, the statistical analysis conducted on geographies consisting of 110,144,981 people shows a poor negative correlation between the proportion of Sudanese and percentage of population with at least associate's degree education in the United States with a correlation coefficient (R) of -0.198 and weighted average of 47.1%, a difference of 11.9%.
Associate's Degree Correlation Summary
| Measurement | Immigrants from Bahamas | Sudanese |
| Minimum | 13.7% | 15.8% |
| Maximum | 69.9% | 74.0% |
| Range | 56.2% | 58.2% |
| Mean | 38.8% | 43.5% |
| Median | 39.0% | 44.6% |
| Interquartile 25% (IQ1) | 29.0% | 37.6% |
| Interquartile 75% (IQ3) | 46.1% | 50.2% |
| Interquartile Range (IQR) | 17.0% | 12.6% |
| Standard Deviation (Sample) | 12.7% | 12.9% |
| Standard Deviation (Population) | 12.6% | 12.8% |
Similar Demographics by Associate's Degree
Demographics Similar to Immigrants from Bahamas by Associate's Degree
In terms of associate's degree, the demographic groups most similar to Immigrants from Bahamas are U.S. Virgin Islander (42.1%, a difference of 0.020%), Jamaican (42.1%, a difference of 0.030%), Immigrants from Ecuador (42.2%, a difference of 0.18%), Immigrants from Fiji (42.2%, a difference of 0.26%), and Delaware (42.3%, a difference of 0.35%).
| Demographics | Rating | Rank | Associate's Degree |
| Immigrants | Liberia | 0.9 /100 | #244 | Tragic 42.3% |
| Immigrants | Cambodia | 0.9 /100 | #245 | Tragic 42.3% |
| Delaware | 0.9 /100 | #246 | Tragic 42.3% |
| Immigrants | Fiji | 0.8 /100 | #247 | Tragic 42.2% |
| Immigrants | Ecuador | 0.8 /100 | #248 | Tragic 42.2% |
| Jamaicans | 0.7 /100 | #249 | Tragic 42.1% |
| U.S. Virgin Islanders | 0.7 /100 | #250 | Tragic 42.1% |
| Immigrants | Bahamas | 0.7 /100 | #251 | Tragic 42.1% |
| French American Indians | 0.6 /100 | #252 | Tragic 42.0% |
| Indonesians | 0.6 /100 | #253 | Tragic 41.9% |
| Cubans | 0.6 /100 | #254 | Tragic 41.9% |
| Immigrants | Guyana | 0.5 /100 | #255 | Tragic 41.8% |
| Immigrants | Congo | 0.5 /100 | #256 | Tragic 41.8% |
| Spanish Americans | 0.5 /100 | #257 | Tragic 41.8% |
| Japanese | 0.5 /100 | #258 | Tragic 41.7% |
Demographics Similar to Sudanese by Associate's Degree
In terms of associate's degree, the demographic groups most similar to Sudanese are South American (47.1%, a difference of 0.020%), Kenyan (47.1%, a difference of 0.030%), Immigrants from Germany (47.1%, a difference of 0.040%), Immigrants from Poland (47.1%, a difference of 0.090%), and Immigrants from Kenya (47.2%, a difference of 0.16%).
| Demographics | Rating | Rank | Associate's Degree |
| Iraqis | 76.2 /100 | #150 | Good 47.4% |
| Immigrants | North Macedonia | 76.0 /100 | #151 | Good 47.4% |
| Immigrants | Afghanistan | 74.3 /100 | #152 | Good 47.3% |
| Czechs | 72.2 /100 | #153 | Good 47.2% |
| Immigrants | Kenya | 72.1 /100 | #154 | Good 47.2% |
| Kenyans | 70.6 /100 | #155 | Good 47.1% |
| South Americans | 70.5 /100 | #156 | Good 47.1% |
| Sudanese | 70.3 /100 | #157 | Good 47.1% |
| Immigrants | Germany | 69.7 /100 | #158 | Good 47.1% |
| Immigrants | Poland | 69.2 /100 | #159 | Good 47.1% |
| Scottish | 65.4 /100 | #160 | Good 46.9% |
| Scandinavians | 65.2 /100 | #161 | Good 46.9% |
| Immigrants | Africa | 63.2 /100 | #162 | Good 46.8% |
| Somalis | 62.5 /100 | #163 | Good 46.8% |
| Colombians | 62.4 /100 | #164 | Good 46.8% |