Maltese vs Seminole College, Under 1 year
COMPARE
Maltese
Seminole
College, Under 1 year
College, Under 1 year Comparison
Maltese
Seminole
69.5%
COLLEGE, UNDER 1 YEAR
99.7/ 100
METRIC RATING
55th/ 347
METRIC RANK
59.1%
COLLEGE, UNDER 1 YEAR
0.0/ 100
METRIC RATING
293rd/ 347
METRIC RANK
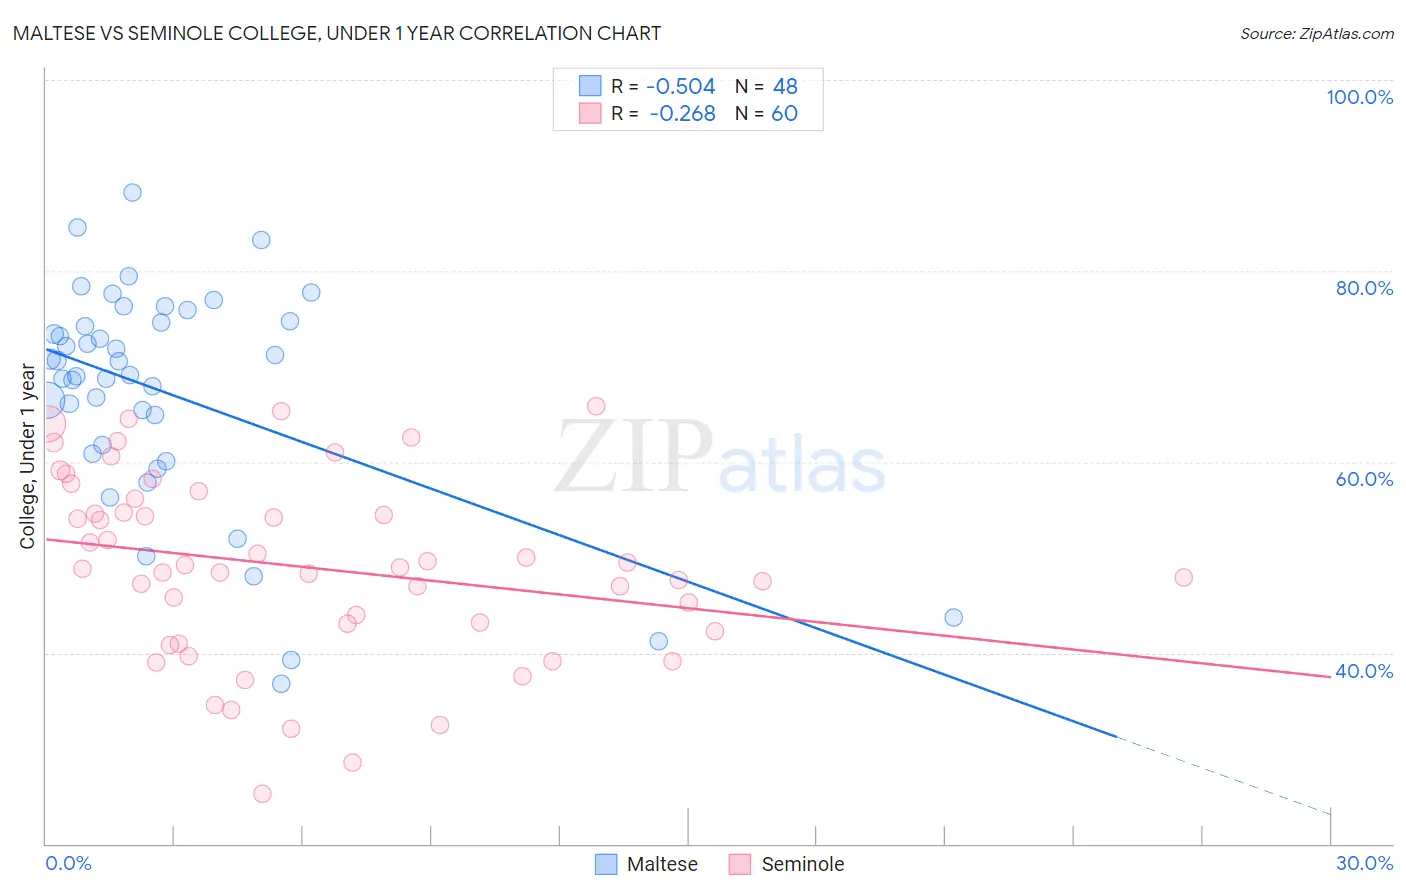
Maltese vs Seminole College, Under 1 year Correlation Chart
The statistical analysis conducted on geographies consisting of 126,478,070 people shows a substantial negative correlation between the proportion of Maltese and percentage of population with at least college, under 1 year education in the United States with a correlation coefficient (R) of -0.504 and weighted average of 69.5%. Similarly, the statistical analysis conducted on geographies consisting of 118,314,121 people shows a weak negative correlation between the proportion of Seminole and percentage of population with at least college, under 1 year education in the United States with a correlation coefficient (R) of -0.268 and weighted average of 59.1%, a difference of 17.5%.
College, Under 1 year Correlation Summary
| Measurement | Maltese | Seminole |
| Minimum | 36.8% | 25.3% |
| Maximum | 88.3% | 65.8% |
| Range | 51.5% | 40.5% |
| Mean | 67.2% | 49.0% |
| Median | 69.8% | 48.8% |
| Interquartile 25% (IQ1) | 61.3% | 42.7% |
| Interquartile 75% (IQ3) | 74.7% | 55.4% |
| Interquartile Range (IQR) | 13.3% | 12.7% |
| Standard Deviation (Sample) | 11.7% | 9.6% |
| Standard Deviation (Population) | 11.6% | 9.5% |
Similar Demographics by College, Under 1 year
Demographics Similar to Maltese by College, Under 1 year
In terms of college, under 1 year, the demographic groups most similar to Maltese are Immigrants from Czechoslovakia (69.6%, a difference of 0.10%), Immigrants from Scotland (69.4%, a difference of 0.12%), Asian (69.4%, a difference of 0.14%), South African (69.7%, a difference of 0.22%), and Immigrants from Malaysia (69.3%, a difference of 0.24%).
| Demographics | Rating | Rank | College, Under 1 year |
| Immigrants | Netherlands | 99.8 /100 | #48 | Exceptional 70.0% |
| Immigrants | Austria | 99.8 /100 | #49 | Exceptional 70.0% |
| Zimbabweans | 99.8 /100 | #50 | Exceptional 69.9% |
| Mongolians | 99.8 /100 | #51 | Exceptional 69.9% |
| Immigrants | Russia | 99.8 /100 | #52 | Exceptional 69.9% |
| South Africans | 99.7 /100 | #53 | Exceptional 69.7% |
| Immigrants | Czechoslovakia | 99.7 /100 | #54 | Exceptional 69.6% |
| Maltese | 99.7 /100 | #55 | Exceptional 69.5% |
| Immigrants | Scotland | 99.6 /100 | #56 | Exceptional 69.4% |
| Asians | 99.6 /100 | #57 | Exceptional 69.4% |
| Immigrants | Malaysia | 99.6 /100 | #58 | Exceptional 69.3% |
| Immigrants | Serbia | 99.5 /100 | #59 | Exceptional 69.3% |
| Immigrants | Asia | 99.5 /100 | #60 | Exceptional 69.2% |
| Immigrants | Kazakhstan | 99.5 /100 | #61 | Exceptional 69.2% |
| Immigrants | Belarus | 99.5 /100 | #62 | Exceptional 69.2% |
Demographics Similar to Seminole by College, Under 1 year
In terms of college, under 1 year, the demographic groups most similar to Seminole are Immigrants from Belize (59.1%, a difference of 0.020%), Immigrants from Grenada (59.1%, a difference of 0.12%), Central American Indian (59.0%, a difference of 0.16%), Nicaraguan (59.2%, a difference of 0.18%), and Guyanese (59.0%, a difference of 0.21%).
| Demographics | Rating | Rank | College, Under 1 year |
| British West Indians | 0.0 /100 | #286 | Tragic 59.5% |
| Sioux | 0.0 /100 | #287 | Tragic 59.4% |
| Blacks/African Americans | 0.0 /100 | #288 | Tragic 59.4% |
| Choctaw | 0.0 /100 | #289 | Tragic 59.3% |
| Ecuadorians | 0.0 /100 | #290 | Tragic 59.3% |
| Creek | 0.0 /100 | #291 | Tragic 59.3% |
| Nicaraguans | 0.0 /100 | #292 | Tragic 59.2% |
| Seminole | 0.0 /100 | #293 | Tragic 59.1% |
| Immigrants | Belize | 0.0 /100 | #294 | Tragic 59.1% |
| Immigrants | Grenada | 0.0 /100 | #295 | Tragic 59.1% |
| Central American Indians | 0.0 /100 | #296 | Tragic 59.0% |
| Guyanese | 0.0 /100 | #297 | Tragic 59.0% |
| Immigrants | Ecuador | 0.0 /100 | #298 | Tragic 58.7% |
| Cubans | 0.0 /100 | #299 | Tragic 58.6% |
| Immigrants | Guyana | 0.0 /100 | #300 | Tragic 58.5% |