Immigrants from Cameroon vs Immigrants from Pakistan College, Under 1 year
COMPARE
Immigrants from Cameroon
Immigrants from Pakistan
College, Under 1 year
College, Under 1 year Comparison
Immigrants from Cameroon
Immigrants from Pakistan
64.6%
COLLEGE, UNDER 1 YEAR
24.6/ 100
METRIC RATING
194th/ 347
METRIC RANK
68.0%
COLLEGE, UNDER 1 YEAR
97.5/ 100
METRIC RATING
95th/ 347
METRIC RANK
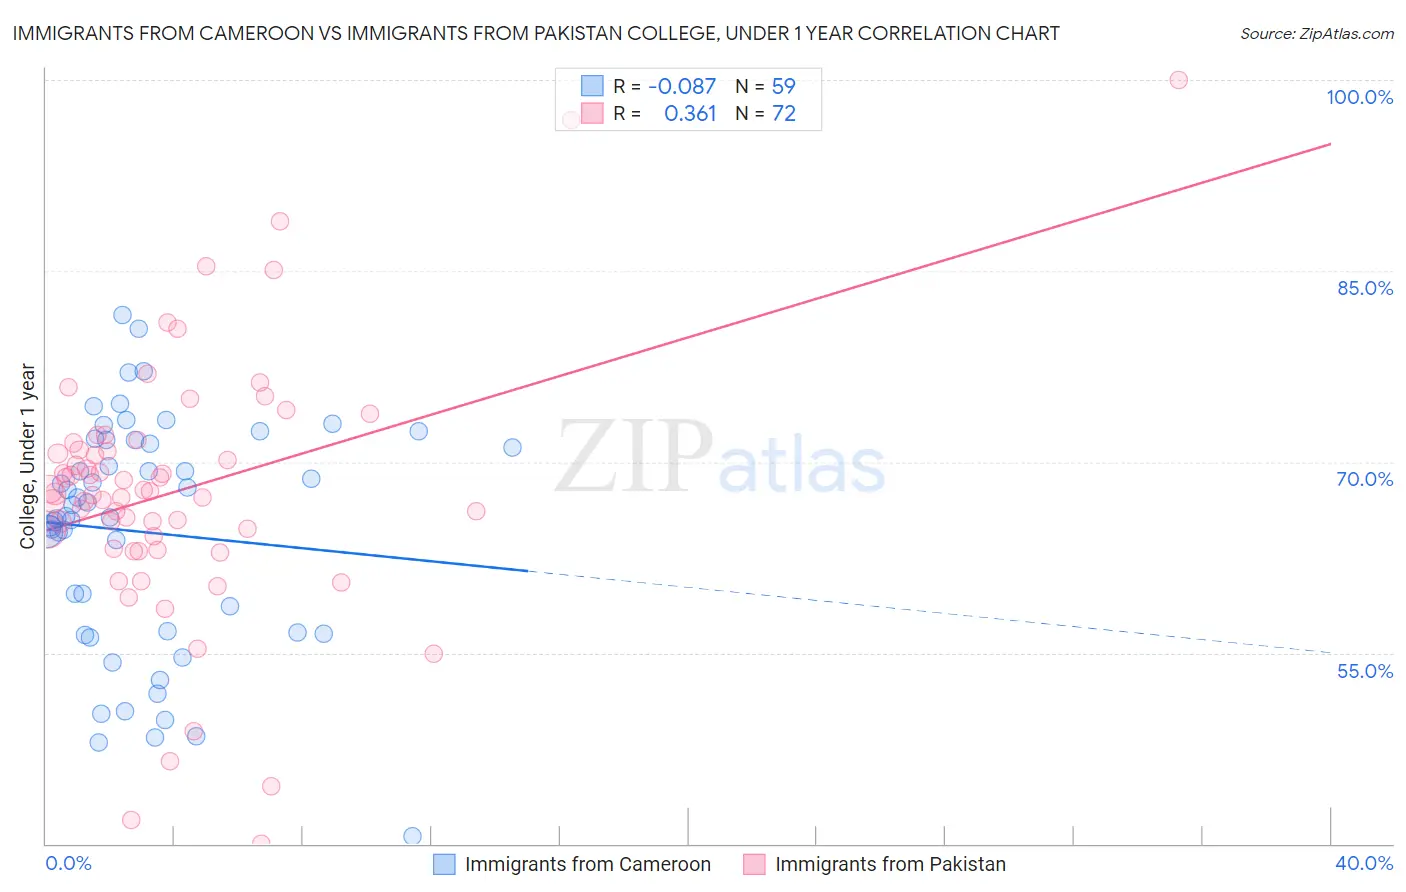
Immigrants from Cameroon vs Immigrants from Pakistan College, Under 1 year Correlation Chart
The statistical analysis conducted on geographies consisting of 130,767,721 people shows a slight negative correlation between the proportion of Immigrants from Cameroon and percentage of population with at least college, under 1 year education in the United States with a correlation coefficient (R) of -0.087 and weighted average of 64.6%. Similarly, the statistical analysis conducted on geographies consisting of 283,911,472 people shows a mild positive correlation between the proportion of Immigrants from Pakistan and percentage of population with at least college, under 1 year education in the United States with a correlation coefficient (R) of 0.361 and weighted average of 68.0%, a difference of 5.3%.
College, Under 1 year Correlation Summary
| Measurement | Immigrants from Cameroon | Immigrants from Pakistan |
| Minimum | 40.6% | 40.0% |
| Maximum | 81.6% | 100.0% |
| Range | 41.0% | 60.0% |
| Mean | 64.5% | 67.7% |
| Median | 65.7% | 67.6% |
| Interquartile 25% (IQ1) | 56.5% | 63.6% |
| Interquartile 75% (IQ3) | 71.7% | 71.2% |
| Interquartile Range (IQR) | 15.2% | 7.6% |
| Standard Deviation (Sample) | 9.1% | 10.3% |
| Standard Deviation (Population) | 9.0% | 10.2% |
Similar Demographics by College, Under 1 year
Demographics Similar to Immigrants from Cameroon by College, Under 1 year
In terms of college, under 1 year, the demographic groups most similar to Immigrants from Cameroon are Slovak (64.7%, a difference of 0.13%), Immigrants from Thailand (64.7%, a difference of 0.14%), Immigrants from South Eastern Asia (64.5%, a difference of 0.16%), Immigrants from Armenia (64.7%, a difference of 0.20%), and Tongan (64.5%, a difference of 0.21%).
| Demographics | Rating | Rank | College, Under 1 year |
| Immigrants | Southern Europe | 34.3 /100 | #187 | Fair 64.9% |
| Immigrants | Albania | 32.0 /100 | #188 | Fair 64.9% |
| Spanish | 31.6 /100 | #189 | Fair 64.9% |
| Immigrants | Philippines | 30.1 /100 | #190 | Fair 64.8% |
| Immigrants | Armenia | 28.1 /100 | #191 | Fair 64.7% |
| Immigrants | Thailand | 27.0 /100 | #192 | Fair 64.7% |
| Slovaks | 26.7 /100 | #193 | Fair 64.7% |
| Immigrants | Cameroon | 24.6 /100 | #194 | Fair 64.6% |
| Immigrants | South Eastern Asia | 22.1 /100 | #195 | Fair 64.5% |
| Tongans | 21.2 /100 | #196 | Fair 64.5% |
| Costa Ricans | 19.6 /100 | #197 | Poor 64.4% |
| Tsimshian | 17.9 /100 | #198 | Poor 64.3% |
| Panamanians | 17.0 /100 | #199 | Poor 64.3% |
| Nigerians | 16.7 /100 | #200 | Poor 64.3% |
| French Canadians | 16.3 /100 | #201 | Poor 64.2% |
Demographics Similar to Immigrants from Pakistan by College, Under 1 year
In terms of college, under 1 year, the demographic groups most similar to Immigrants from Pakistan are Jordanian (68.0%, a difference of 0.030%), Immigrants from Ethiopia (68.0%, a difference of 0.060%), Armenian (68.1%, a difference of 0.090%), Paraguayan (67.9%, a difference of 0.17%), and Immigrants from Bolivia (67.9%, a difference of 0.18%).
| Demographics | Rating | Rank | College, Under 1 year |
| Croatians | 98.2 /100 | #88 | Exceptional 68.3% |
| Ethiopians | 98.2 /100 | #89 | Exceptional 68.3% |
| Icelanders | 98.1 /100 | #90 | Exceptional 68.3% |
| Europeans | 98.1 /100 | #91 | Exceptional 68.2% |
| Luxembourgers | 98.1 /100 | #92 | Exceptional 68.2% |
| Romanians | 97.9 /100 | #93 | Exceptional 68.2% |
| Armenians | 97.7 /100 | #94 | Exceptional 68.1% |
| Immigrants | Pakistan | 97.5 /100 | #95 | Exceptional 68.0% |
| Jordanians | 97.4 /100 | #96 | Exceptional 68.0% |
| Immigrants | Ethiopia | 97.3 /100 | #97 | Exceptional 68.0% |
| Paraguayans | 97.1 /100 | #98 | Exceptional 67.9% |
| Immigrants | Bolivia | 97.0 /100 | #99 | Exceptional 67.9% |
| Immigrants | Argentina | 97.0 /100 | #100 | Exceptional 67.9% |
| Immigrants | Eastern Europe | 96.9 /100 | #101 | Exceptional 67.9% |
| Palestinians | 96.9 /100 | #102 | Exceptional 67.9% |