Yugoslavian vs Belgian College, 1 year or more
COMPARE
Yugoslavian
Belgian
College, 1 year or more
College, 1 year or more Comparison
Yugoslavians
Belgians
59.2%
COLLEGE, 1 YEAR OR MORE
44.1/ 100
METRIC RATING
180th/ 347
METRIC RANK
59.7%
COLLEGE, 1 YEAR OR MORE
58.1/ 100
METRIC RATING
164th/ 347
METRIC RANK
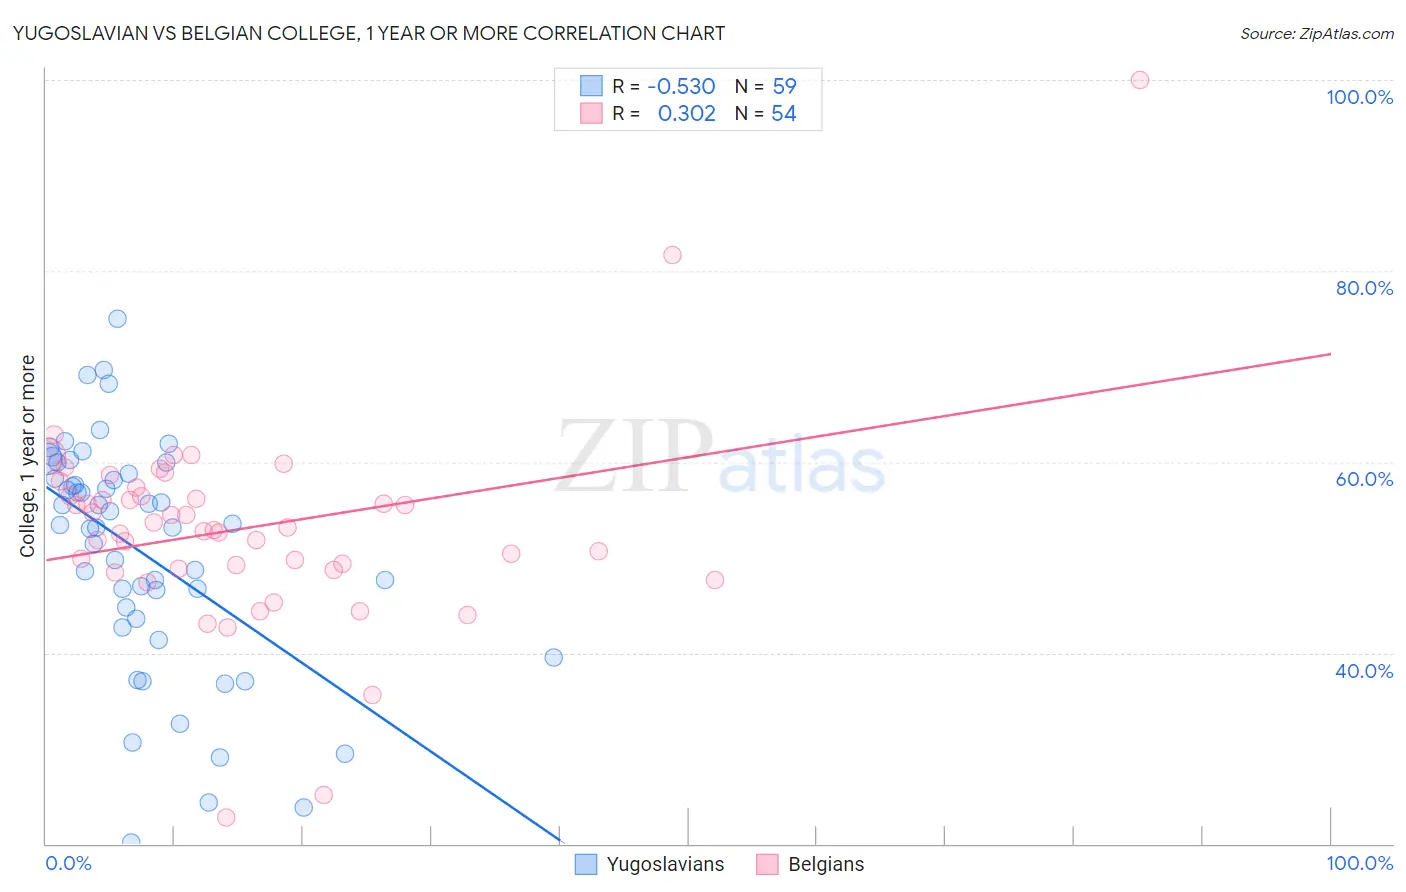
Yugoslavian vs Belgian College, 1 year or more Correlation Chart
The statistical analysis conducted on geographies consisting of 285,723,201 people shows a substantial negative correlation between the proportion of Yugoslavians and percentage of population with at least college, 1 year or more education in the United States with a correlation coefficient (R) of -0.530 and weighted average of 59.2%. Similarly, the statistical analysis conducted on geographies consisting of 356,017,497 people shows a mild positive correlation between the proportion of Belgians and percentage of population with at least college, 1 year or more education in the United States with a correlation coefficient (R) of 0.302 and weighted average of 59.7%, a difference of 0.75%.
College, 1 year or more Correlation Summary
| Measurement | Yugoslavian | Belgian |
| Minimum | 20.1% | 22.8% |
| Maximum | 75.0% | 100.0% |
| Range | 54.9% | 77.2% |
| Mean | 50.6% | 53.1% |
| Median | 53.3% | 53.0% |
| Interquartile 25% (IQ1) | 43.6% | 48.9% |
| Interquartile 75% (IQ3) | 58.8% | 56.4% |
| Interquartile Range (IQR) | 15.2% | 7.6% |
| Standard Deviation (Sample) | 12.1% | 10.9% |
| Standard Deviation (Population) | 12.0% | 10.8% |
Demographics Similar to Yugoslavians and Belgians by College, 1 year or more
In terms of college, 1 year or more, the demographic groups most similar to Yugoslavians are Swiss (59.2%, a difference of 0.040%), Immigrants from Bosnia and Herzegovina (59.2%, a difference of 0.070%), Bermudan (59.3%, a difference of 0.14%), Tlingit-Haida (59.4%, a difference of 0.23%), and Czechoslovakian (59.4%, a difference of 0.23%). Similarly, the demographic groups most similar to Belgians are Immigrants from Somalia (59.7%, a difference of 0.010%), Korean (59.7%, a difference of 0.020%), Irish (59.6%, a difference of 0.11%), Immigrants from Africa (59.6%, a difference of 0.11%), and Immigrants from North Macedonia (59.5%, a difference of 0.27%).
| Demographics | Rating | Rank | College, 1 year or more |
| Koreans | 58.5 /100 | #162 | Average 59.7% |
| Immigrants | Somalia | 58.3 /100 | #163 | Average 59.7% |
| Belgians | 58.1 /100 | #164 | Average 59.7% |
| Irish | 56.1 /100 | #165 | Average 59.6% |
| Immigrants | Africa | 56.1 /100 | #166 | Average 59.6% |
| Immigrants | North Macedonia | 53.1 /100 | #167 | Average 59.5% |
| Hungarians | 52.9 /100 | #168 | Average 59.5% |
| Immigrants | Southern Europe | 52.7 /100 | #169 | Average 59.5% |
| Welsh | 52.4 /100 | #170 | Average 59.5% |
| Immigrants | Albania | 52.3 /100 | #171 | Average 59.5% |
| Immigrants | Sierra Leone | 52.2 /100 | #172 | Average 59.5% |
| Immigrants | Oceania | 51.2 /100 | #173 | Average 59.4% |
| Celtics | 50.0 /100 | #174 | Average 59.4% |
| Sri Lankans | 49.0 /100 | #175 | Average 59.4% |
| Immigrants | Poland | 48.9 /100 | #176 | Average 59.4% |
| Tlingit-Haida | 48.4 /100 | #177 | Average 59.4% |
| Czechoslovakians | 48.3 /100 | #178 | Average 59.4% |
| Bermudans | 46.6 /100 | #179 | Average 59.3% |
| Yugoslavians | 44.1 /100 | #180 | Average 59.2% |
| Swiss | 43.4 /100 | #181 | Average 59.2% |
| Immigrants | Bosnia and Herzegovina | 42.8 /100 | #182 | Average 59.2% |