Immigrants from the Azores vs Immigrants from Thailand GED/Equivalency
COMPARE
Immigrants from the Azores
Immigrants from Thailand
GED/Equivalency
GED/Equivalency Comparison
Immigrants from the Azores
Immigrants from Thailand
78.7%
GED/EQUIVALENCY
0.0/ 100
METRIC RATING
332nd/ 347
METRIC RANK
84.5%
GED/EQUIVALENCY
5.8/ 100
METRIC RATING
225th/ 347
METRIC RANK
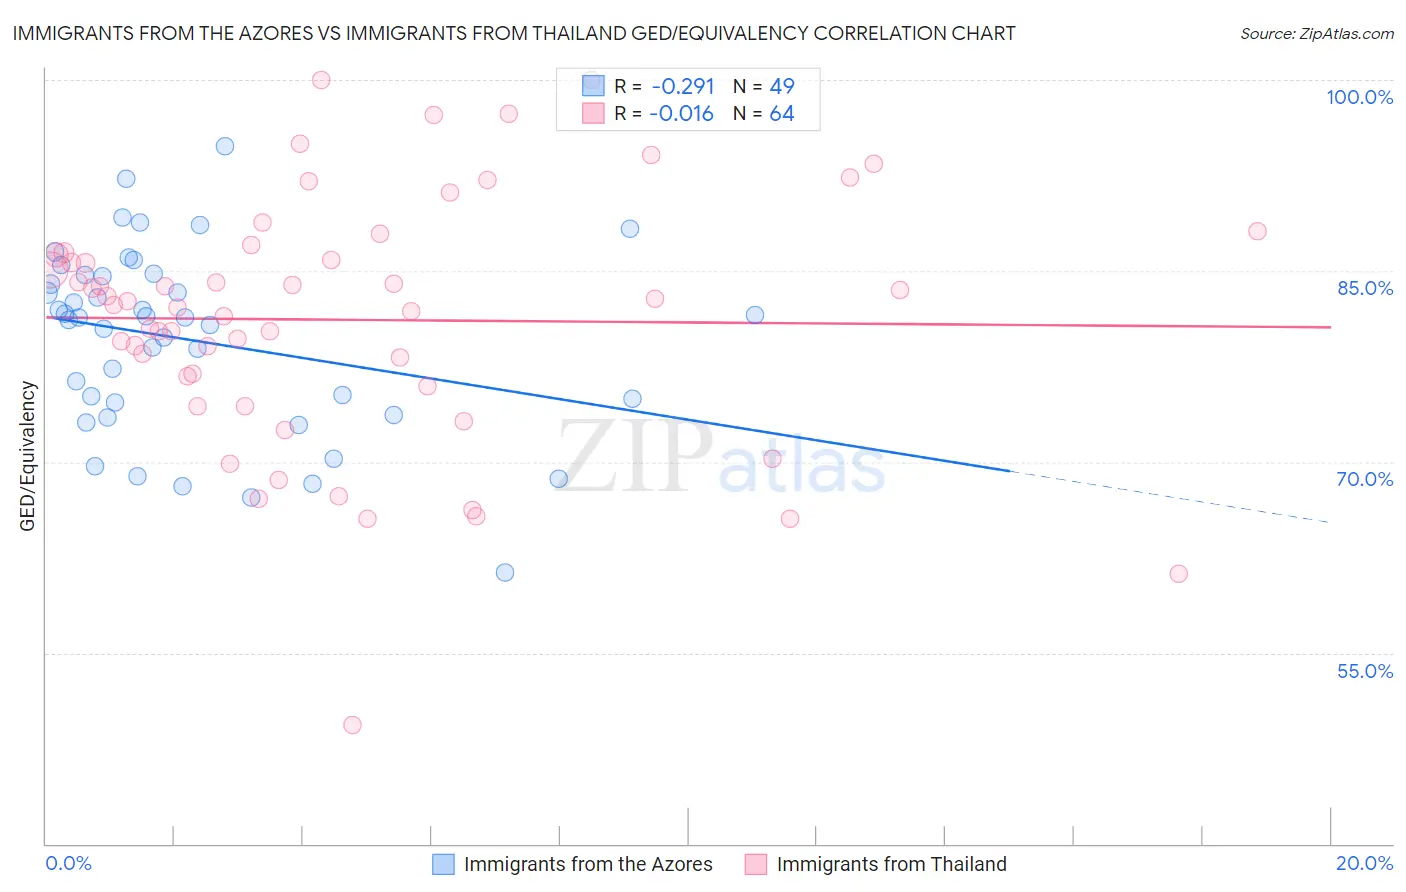
Immigrants from the Azores vs Immigrants from Thailand GED/Equivalency Correlation Chart
The statistical analysis conducted on geographies consisting of 46,257,310 people shows a weak negative correlation between the proportion of Immigrants from the Azores and percentage of population with at least ged/equivalency education in the United States with a correlation coefficient (R) of -0.291 and weighted average of 78.7%. Similarly, the statistical analysis conducted on geographies consisting of 317,022,868 people shows no correlation between the proportion of Immigrants from Thailand and percentage of population with at least ged/equivalency education in the United States with a correlation coefficient (R) of -0.016 and weighted average of 84.5%, a difference of 7.5%.
GED/Equivalency Correlation Summary
| Measurement | Immigrants from the Azores | Immigrants from Thailand |
| Minimum | 61.3% | 49.4% |
| Maximum | 94.8% | 100.0% |
| Range | 33.5% | 50.6% |
| Mean | 79.5% | 81.2% |
| Median | 81.3% | 82.5% |
| Interquartile 25% (IQ1) | 74.2% | 76.4% |
| Interquartile 75% (IQ3) | 84.6% | 86.3% |
| Interquartile Range (IQR) | 10.5% | 10.0% |
| Standard Deviation (Sample) | 7.2% | 9.8% |
| Standard Deviation (Population) | 7.1% | 9.7% |
Similar Demographics by GED/Equivalency
Demographics Similar to Immigrants from the Azores by GED/Equivalency
In terms of ged/equivalency, the demographic groups most similar to Immigrants from the Azores are Immigrants from Honduras (78.7%, a difference of 0.11%), Salvadoran (78.6%, a difference of 0.11%), Guatemalan (78.5%, a difference of 0.20%), Immigrants from Latin America (78.5%, a difference of 0.22%), and Immigrants from Cabo Verde (78.9%, a difference of 0.36%).
| Demographics | Rating | Rank | GED/Equivalency |
| Hondurans | 0.0 /100 | #325 | Tragic 79.3% |
| Yuman | 0.0 /100 | #326 | Tragic 79.2% |
| Central Americans | 0.0 /100 | #327 | Tragic 79.2% |
| Hispanics or Latinos | 0.0 /100 | #328 | Tragic 79.1% |
| Dominicans | 0.0 /100 | #329 | Tragic 79.1% |
| Immigrants | Cabo Verde | 0.0 /100 | #330 | Tragic 78.9% |
| Immigrants | Honduras | 0.0 /100 | #331 | Tragic 78.7% |
| Immigrants | Azores | 0.0 /100 | #332 | Tragic 78.7% |
| Salvadorans | 0.0 /100 | #333 | Tragic 78.6% |
| Guatemalans | 0.0 /100 | #334 | Tragic 78.5% |
| Immigrants | Latin America | 0.0 /100 | #335 | Tragic 78.5% |
| Immigrants | Dominican Republic | 0.0 /100 | #336 | Tragic 78.0% |
| Immigrants | Yemen | 0.0 /100 | #337 | Tragic 77.9% |
| Immigrants | Guatemala | 0.0 /100 | #338 | Tragic 77.9% |
| Immigrants | El Salvador | 0.0 /100 | #339 | Tragic 77.6% |
Demographics Similar to Immigrants from Thailand by GED/Equivalency
In terms of ged/equivalency, the demographic groups most similar to Immigrants from Thailand are Immigrants from Zaire (84.5%, a difference of 0.020%), Immigrants from Costa Rica (84.5%, a difference of 0.040%), French American Indian (84.6%, a difference of 0.050%), Immigrants from Liberia (84.4%, a difference of 0.090%), and Immigrants from Uzbekistan (84.6%, a difference of 0.12%).
| Demographics | Rating | Rank | GED/Equivalency |
| Alaska Natives | 8.6 /100 | #218 | Tragic 84.7% |
| Potawatomi | 8.2 /100 | #219 | Tragic 84.7% |
| Americans | 8.2 /100 | #220 | Tragic 84.7% |
| Taiwanese | 8.1 /100 | #221 | Tragic 84.7% |
| Iroquois | 7.5 /100 | #222 | Tragic 84.6% |
| Immigrants | Uzbekistan | 7.1 /100 | #223 | Tragic 84.6% |
| French American Indians | 6.3 /100 | #224 | Tragic 84.6% |
| Immigrants | Thailand | 5.8 /100 | #225 | Tragic 84.5% |
| Immigrants | Zaire | 5.5 /100 | #226 | Tragic 84.5% |
| Immigrants | Costa Rica | 5.4 /100 | #227 | Tragic 84.5% |
| Immigrants | Liberia | 4.9 /100 | #228 | Tragic 84.4% |
| Immigrants | Uruguay | 4.6 /100 | #229 | Tragic 84.4% |
| Immigrants | Colombia | 4.5 /100 | #230 | Tragic 84.4% |
| Immigrants | Middle Africa | 4.3 /100 | #231 | Tragic 84.4% |
| Immigrants | South America | 4.2 /100 | #232 | Tragic 84.4% |