Immigrants from the Azores vs Scottish GED/Equivalency
COMPARE
Immigrants from the Azores
Scottish
GED/Equivalency
GED/Equivalency Comparison
Immigrants from the Azores
Scottish
78.7%
GED/EQUIVALENCY
0.0/ 100
METRIC RATING
332nd/ 347
METRIC RANK
87.7%
GED/EQUIVALENCY
98.7/ 100
METRIC RATING
75th/ 347
METRIC RANK
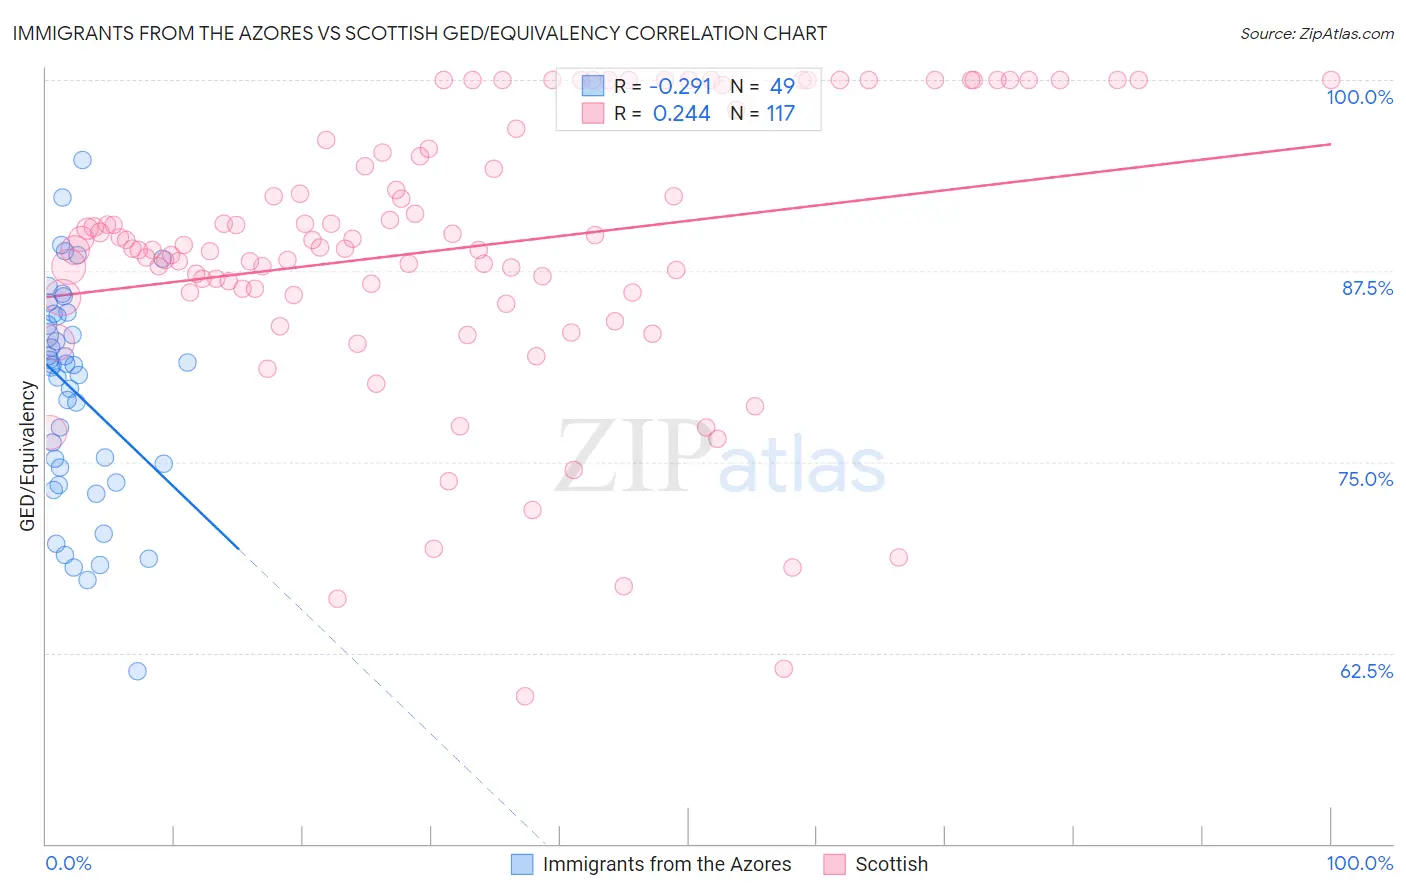
Immigrants from the Azores vs Scottish GED/Equivalency Correlation Chart
The statistical analysis conducted on geographies consisting of 46,257,310 people shows a weak negative correlation between the proportion of Immigrants from the Azores and percentage of population with at least ged/equivalency education in the United States with a correlation coefficient (R) of -0.291 and weighted average of 78.7%. Similarly, the statistical analysis conducted on geographies consisting of 567,141,608 people shows a weak positive correlation between the proportion of Scottish and percentage of population with at least ged/equivalency education in the United States with a correlation coefficient (R) of 0.244 and weighted average of 87.7%, a difference of 11.5%.
GED/Equivalency Correlation Summary
| Measurement | Immigrants from the Azores | Scottish |
| Minimum | 61.3% | 59.6% |
| Maximum | 94.8% | 100.0% |
| Range | 33.5% | 40.4% |
| Mean | 79.5% | 89.0% |
| Median | 81.3% | 89.0% |
| Interquartile 25% (IQ1) | 74.2% | 86.1% |
| Interquartile 75% (IQ3) | 84.6% | 95.8% |
| Interquartile Range (IQR) | 10.5% | 9.7% |
| Standard Deviation (Sample) | 7.2% | 9.0% |
| Standard Deviation (Population) | 7.1% | 9.0% |
Similar Demographics by GED/Equivalency
Demographics Similar to Immigrants from the Azores by GED/Equivalency
In terms of ged/equivalency, the demographic groups most similar to Immigrants from the Azores are Immigrants from Honduras (78.7%, a difference of 0.11%), Salvadoran (78.6%, a difference of 0.11%), Guatemalan (78.5%, a difference of 0.20%), Immigrants from Latin America (78.5%, a difference of 0.22%), and Immigrants from Cabo Verde (78.9%, a difference of 0.36%).
| Demographics | Rating | Rank | GED/Equivalency |
| Hondurans | 0.0 /100 | #325 | Tragic 79.3% |
| Yuman | 0.0 /100 | #326 | Tragic 79.2% |
| Central Americans | 0.0 /100 | #327 | Tragic 79.2% |
| Hispanics or Latinos | 0.0 /100 | #328 | Tragic 79.1% |
| Dominicans | 0.0 /100 | #329 | Tragic 79.1% |
| Immigrants | Cabo Verde | 0.0 /100 | #330 | Tragic 78.9% |
| Immigrants | Honduras | 0.0 /100 | #331 | Tragic 78.7% |
| Immigrants | Azores | 0.0 /100 | #332 | Tragic 78.7% |
| Salvadorans | 0.0 /100 | #333 | Tragic 78.6% |
| Guatemalans | 0.0 /100 | #334 | Tragic 78.5% |
| Immigrants | Latin America | 0.0 /100 | #335 | Tragic 78.5% |
| Immigrants | Dominican Republic | 0.0 /100 | #336 | Tragic 78.0% |
| Immigrants | Yemen | 0.0 /100 | #337 | Tragic 77.9% |
| Immigrants | Guatemala | 0.0 /100 | #338 | Tragic 77.9% |
| Immigrants | El Salvador | 0.0 /100 | #339 | Tragic 77.6% |
Demographics Similar to Scottish by GED/Equivalency
In terms of ged/equivalency, the demographic groups most similar to Scottish are Immigrants from Serbia (87.7%, a difference of 0.010%), Immigrants from Kuwait (87.7%, a difference of 0.020%), Slavic (87.7%, a difference of 0.020%), Belgian (87.7%, a difference of 0.030%), and Irish (87.6%, a difference of 0.040%).
| Demographics | Rating | Rank | GED/Equivalency |
| Immigrants | France | 99.1 /100 | #68 | Exceptional 87.8% |
| Immigrants | Saudi Arabia | 99.0 /100 | #69 | Exceptional 87.8% |
| Ukrainians | 98.8 /100 | #70 | Exceptional 87.7% |
| Austrians | 98.8 /100 | #71 | Exceptional 87.7% |
| Immigrants | Moldova | 98.8 /100 | #72 | Exceptional 87.7% |
| Belgians | 98.8 /100 | #73 | Exceptional 87.7% |
| Immigrants | Kuwait | 98.8 /100 | #74 | Exceptional 87.7% |
| Scottish | 98.7 /100 | #75 | Exceptional 87.7% |
| Immigrants | Serbia | 98.7 /100 | #76 | Exceptional 87.7% |
| Slavs | 98.7 /100 | #77 | Exceptional 87.7% |
| Irish | 98.6 /100 | #78 | Exceptional 87.6% |
| English | 98.6 /100 | #79 | Exceptional 87.6% |
| Immigrants | England | 98.5 /100 | #80 | Exceptional 87.6% |
| Immigrants | Sri Lanka | 98.3 /100 | #81 | Exceptional 87.5% |
| Romanians | 98.3 /100 | #82 | Exceptional 87.5% |