Immigrants from Australia vs Guamanian/Chamorro Householder Income Ages 45 - 64 years
COMPARE
Immigrants from Australia
Guamanian/Chamorro
Householder Income Ages 45 - 64 years
Householder Income Ages 45 - 64 years Comparison
Immigrants from Australia
Guamanians/Chamorros
$119,308
HOUSEHOLDER INCOME AGES 45 - 64 YEARS
100.0/ 100
METRIC RATING
20th/ 347
METRIC RANK
$101,170
HOUSEHOLDER INCOME AGES 45 - 64 YEARS
60.5/ 100
METRIC RATING
169th/ 347
METRIC RANK
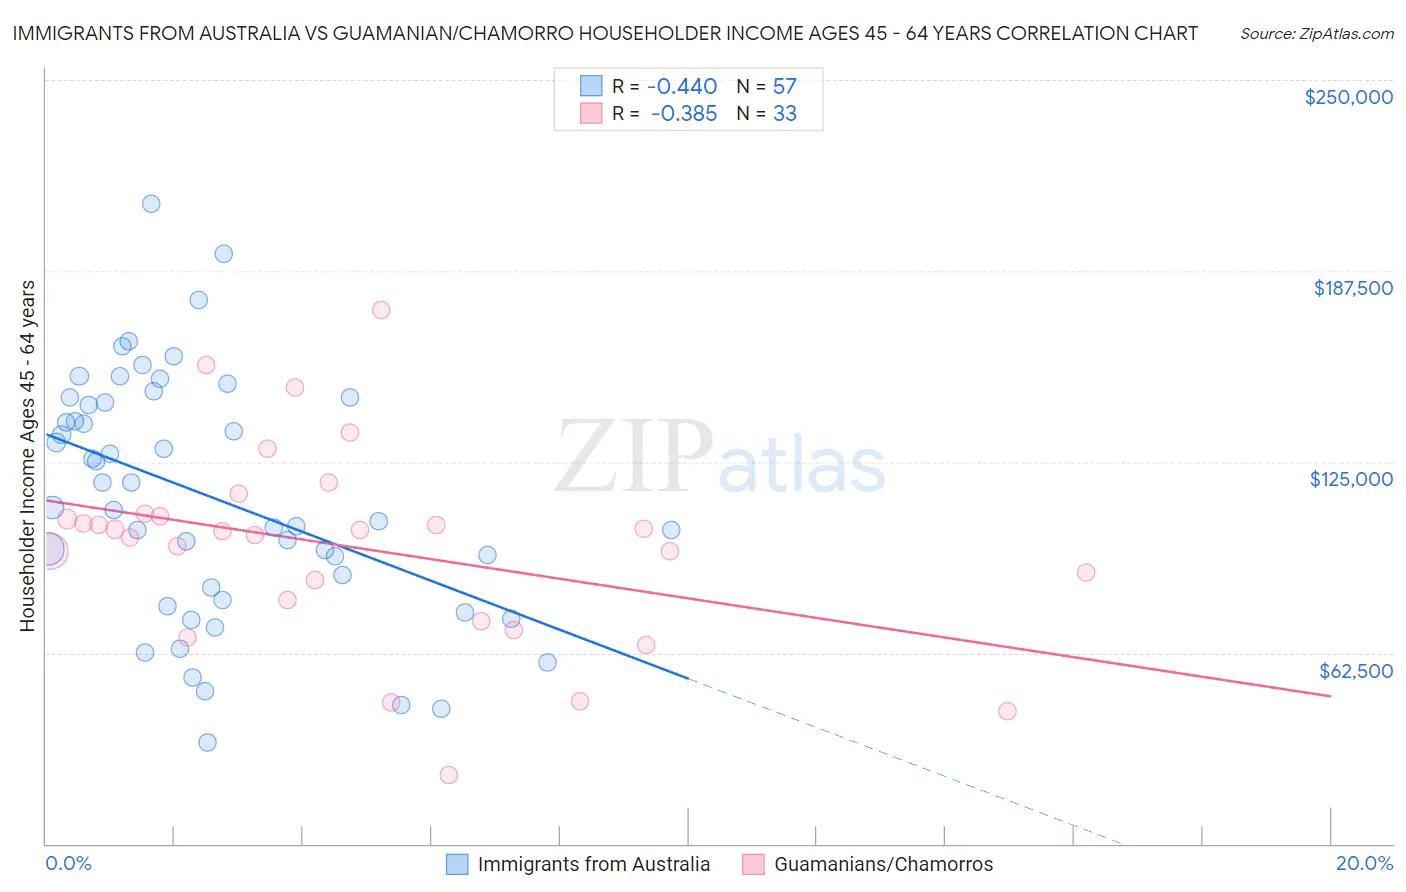
Immigrants from Australia vs Guamanian/Chamorro Householder Income Ages 45 - 64 years Correlation Chart
The statistical analysis conducted on geographies consisting of 227,010,671 people shows a moderate negative correlation between the proportion of Immigrants from Australia and household income with householder between the ages 45 and 64 in the United States with a correlation coefficient (R) of -0.440 and weighted average of $119,308. Similarly, the statistical analysis conducted on geographies consisting of 221,751,742 people shows a mild negative correlation between the proportion of Guamanians/Chamorros and household income with householder between the ages 45 and 64 in the United States with a correlation coefficient (R) of -0.385 and weighted average of $101,170, a difference of 17.9%.
Householder Income Ages 45 - 64 years Correlation Summary
| Measurement | Immigrants from Australia | Guamanian/Chamorro |
| Minimum | $33,125 | $22,381 |
| Maximum | $209,440 | $174,529 |
| Range | $176,315 | $152,148 |
| Mean | $113,549 | $97,072 |
| Median | $110,175 | $102,408 |
| Interquartile 25% (IQ1) | $81,830 | $76,408 |
| Interquartile 75% (IQ3) | $145,190 | $107,629 |
| Interquartile Range (IQR) | $63,360 | $31,221 |
| Standard Deviation (Sample) | $39,602 | $32,320 |
| Standard Deviation (Population) | $39,253 | $31,826 |
Similar Demographics by Householder Income Ages 45 - 64 years
Demographics Similar to Immigrants from Australia by Householder Income Ages 45 - 64 years
In terms of householder income ages 45 - 64 years, the demographic groups most similar to Immigrants from Australia are Immigrants from Sri Lanka ($119,094, a difference of 0.18%), Immigrants from Belgium ($118,932, a difference of 0.32%), Bolivian ($118,871, a difference of 0.37%), Immigrants from Japan ($118,498, a difference of 0.68%), and Asian ($118,426, a difference of 0.74%).
| Demographics | Rating | Rank | Householder Income Ages 45 - 64 years |
| Immigrants | Ireland | 100.0 /100 | #13 | Exceptional $122,757 |
| Indians (Asian) | 100.0 /100 | #14 | Exceptional $122,343 |
| Immigrants | Eastern Asia | 100.0 /100 | #15 | Exceptional $122,222 |
| Immigrants | China | 100.0 /100 | #16 | Exceptional $122,178 |
| Burmese | 100.0 /100 | #17 | Exceptional $121,444 |
| Immigrants | Korea | 100.0 /100 | #18 | Exceptional $121,243 |
| Eastern Europeans | 100.0 /100 | #19 | Exceptional $120,684 |
| Immigrants | Australia | 100.0 /100 | #20 | Exceptional $119,308 |
| Immigrants | Sri Lanka | 100.0 /100 | #21 | Exceptional $119,094 |
| Immigrants | Belgium | 100.0 /100 | #22 | Exceptional $118,932 |
| Bolivians | 100.0 /100 | #23 | Exceptional $118,871 |
| Immigrants | Japan | 100.0 /100 | #24 | Exceptional $118,498 |
| Asians | 100.0 /100 | #25 | Exceptional $118,426 |
| Immigrants | Sweden | 100.0 /100 | #26 | Exceptional $118,318 |
| Immigrants | Northern Europe | 100.0 /100 | #27 | Exceptional $117,930 |
Demographics Similar to Guamanians/Chamorros by Householder Income Ages 45 - 64 years
In terms of householder income ages 45 - 64 years, the demographic groups most similar to Guamanians/Chamorros are South American Indian ($101,171, a difference of 0.0%), Slovak ($101,029, a difference of 0.14%), Czechoslovakian ($101,387, a difference of 0.21%), South American ($100,837, a difference of 0.33%), and Samoan ($101,580, a difference of 0.41%).
| Demographics | Rating | Rank | Householder Income Ages 45 - 64 years |
| Scottish | 71.1 /100 | #162 | Good $102,123 |
| English | 70.1 /100 | #163 | Good $102,021 |
| Immigrants | Morocco | 70.0 /100 | #164 | Good $102,015 |
| Immigrants | Albania | 69.4 /100 | #165 | Good $101,957 |
| Samoans | 65.3 /100 | #166 | Good $101,580 |
| Czechoslovakians | 63.0 /100 | #167 | Good $101,387 |
| South American Indians | 60.5 /100 | #168 | Good $101,171 |
| Guamanians/Chamorros | 60.5 /100 | #169 | Good $101,170 |
| Slovaks | 58.8 /100 | #170 | Average $101,029 |
| South Americans | 56.4 /100 | #171 | Average $100,837 |
| Immigrants | Uzbekistan | 52.5 /100 | #172 | Average $100,523 |
| Alsatians | 51.4 /100 | #173 | Average $100,435 |
| Welsh | 50.0 /100 | #174 | Average $100,322 |
| Germans | 48.8 /100 | #175 | Average $100,224 |
| Immigrants | Costa Rica | 47.7 /100 | #176 | Average $100,141 |