Immigrants from Argentina vs Delaware College, Under 1 year
COMPARE
Immigrants from Argentina
Delaware
College, Under 1 year
College, Under 1 year Comparison
Immigrants from Argentina
Delaware
67.9%
COLLEGE, UNDER 1 YEAR
97.0/ 100
METRIC RATING
100th/ 347
METRIC RANK
62.1%
COLLEGE, UNDER 1 YEAR
0.9/ 100
METRIC RATING
245th/ 347
METRIC RANK
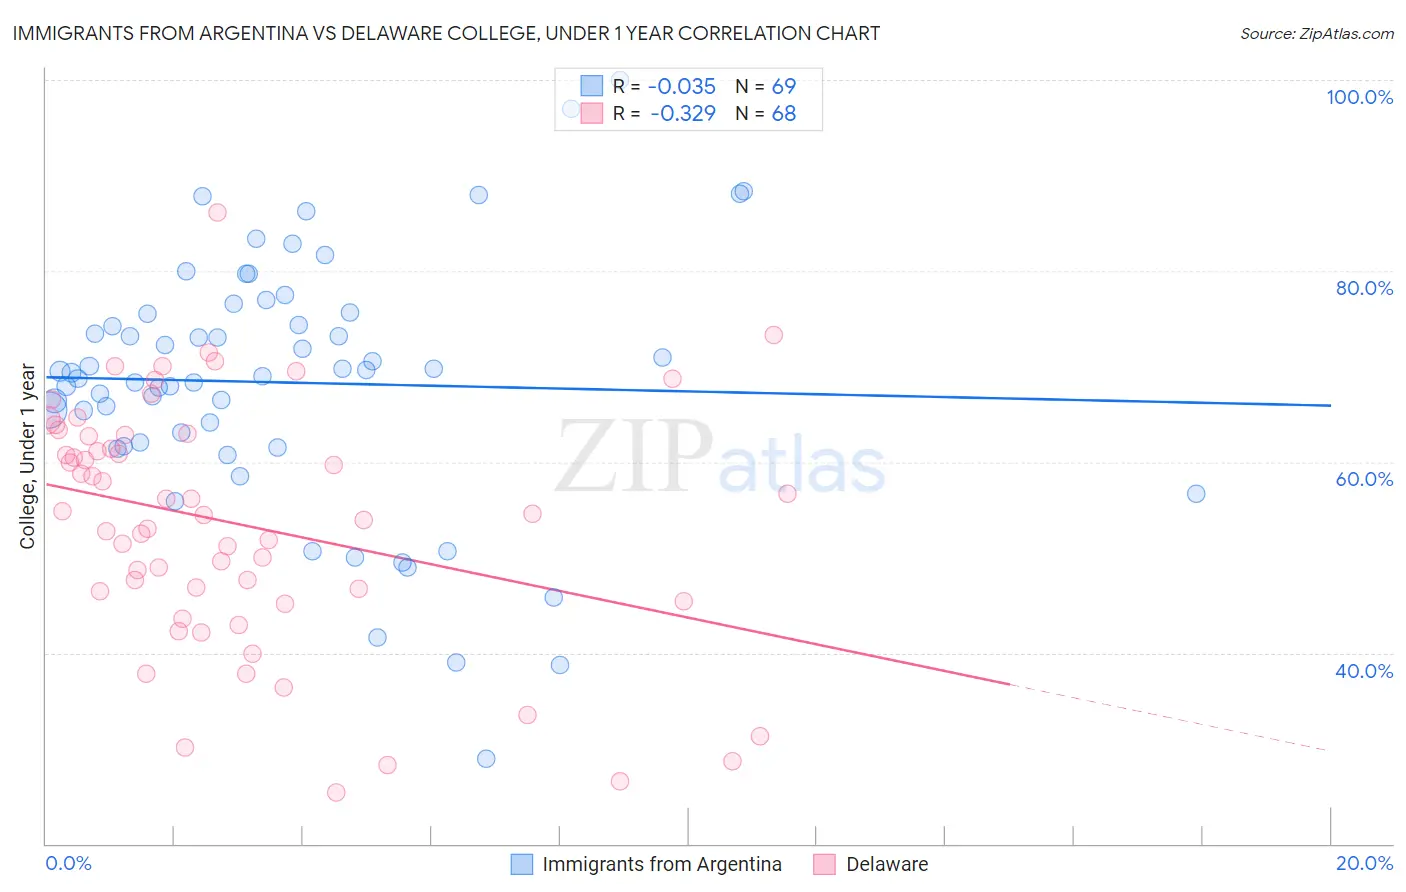
Immigrants from Argentina vs Delaware College, Under 1 year Correlation Chart
The statistical analysis conducted on geographies consisting of 264,437,906 people shows no correlation between the proportion of Immigrants from Argentina and percentage of population with at least college, under 1 year education in the United States with a correlation coefficient (R) of -0.035 and weighted average of 67.9%. Similarly, the statistical analysis conducted on geographies consisting of 96,235,398 people shows a mild negative correlation between the proportion of Delaware and percentage of population with at least college, under 1 year education in the United States with a correlation coefficient (R) of -0.329 and weighted average of 62.1%, a difference of 9.5%.
College, Under 1 year Correlation Summary
| Measurement | Immigrants from Argentina | Delaware |
| Minimum | 29.0% | 25.3% |
| Maximum | 100.0% | 86.2% |
| Range | 71.0% | 60.9% |
| Mean | 68.3% | 53.5% |
| Median | 69.3% | 54.5% |
| Interquartile 25% (IQ1) | 61.9% | 45.9% |
| Interquartile 75% (IQ3) | 75.6% | 62.7% |
| Interquartile Range (IQR) | 13.7% | 16.8% |
| Standard Deviation (Sample) | 13.4% | 12.8% |
| Standard Deviation (Population) | 13.3% | 12.7% |
Similar Demographics by College, Under 1 year
Demographics Similar to Immigrants from Argentina by College, Under 1 year
In terms of college, under 1 year, the demographic groups most similar to Immigrants from Argentina are Immigrants from Bolivia (67.9%, a difference of 0.010%), Paraguayan (67.9%, a difference of 0.030%), Immigrants from Eastern Europe (67.9%, a difference of 0.050%), Palestinian (67.9%, a difference of 0.050%), and Carpatho Rusyn (67.9%, a difference of 0.060%).
| Demographics | Rating | Rank | College, Under 1 year |
| Romanians | 97.9 /100 | #93 | Exceptional 68.2% |
| Armenians | 97.7 /100 | #94 | Exceptional 68.1% |
| Immigrants | Pakistan | 97.5 /100 | #95 | Exceptional 68.0% |
| Jordanians | 97.4 /100 | #96 | Exceptional 68.0% |
| Immigrants | Ethiopia | 97.3 /100 | #97 | Exceptional 68.0% |
| Paraguayans | 97.1 /100 | #98 | Exceptional 67.9% |
| Immigrants | Bolivia | 97.0 /100 | #99 | Exceptional 67.9% |
| Immigrants | Argentina | 97.0 /100 | #100 | Exceptional 67.9% |
| Immigrants | Eastern Europe | 96.9 /100 | #101 | Exceptional 67.9% |
| Palestinians | 96.9 /100 | #102 | Exceptional 67.9% |
| Carpatho Rusyns | 96.8 /100 | #103 | Exceptional 67.9% |
| Immigrants | Western Asia | 96.6 /100 | #104 | Exceptional 67.8% |
| Afghans | 96.6 /100 | #105 | Exceptional 67.8% |
| Immigrants | Croatia | 96.6 /100 | #106 | Exceptional 67.8% |
| Austrians | 96.4 /100 | #107 | Exceptional 67.8% |
Demographics Similar to Delaware by College, Under 1 year
In terms of college, under 1 year, the demographic groups most similar to Delaware are Colville (62.1%, a difference of 0.060%), Hawaiian (62.1%, a difference of 0.15%), Malaysian (62.2%, a difference of 0.18%), Marshallese (61.9%, a difference of 0.22%), and Ottawa (62.2%, a difference of 0.23%).
| Demographics | Rating | Rank | College, Under 1 year |
| French American Indians | 1.5 /100 | #238 | Tragic 62.4% |
| Nepalese | 1.1 /100 | #239 | Tragic 62.2% |
| Aleuts | 1.1 /100 | #240 | Tragic 62.2% |
| Ottawa | 1.1 /100 | #241 | Tragic 62.2% |
| Malaysians | 1.1 /100 | #242 | Tragic 62.2% |
| Hawaiians | 1.1 /100 | #243 | Tragic 62.1% |
| Colville | 1.0 /100 | #244 | Tragic 62.1% |
| Delaware | 0.9 /100 | #245 | Tragic 62.1% |
| Marshallese | 0.8 /100 | #246 | Tragic 61.9% |
| Immigrants | Liberia | 0.8 /100 | #247 | Tragic 61.9% |
| Potawatomi | 0.6 /100 | #248 | Tragic 61.8% |
| Vietnamese | 0.5 /100 | #249 | Tragic 61.7% |
| Immigrants | Congo | 0.5 /100 | #250 | Tragic 61.7% |
| Immigrants | Micronesia | 0.5 /100 | #251 | Tragic 61.5% |
| West Indians | 0.4 /100 | #252 | Tragic 61.5% |