Immigrants from Argentina vs Pima Unemployment Among Women with Children Under 6 years
COMPARE
Immigrants from Argentina
Pima
Unemployment Among Women with Children Under 6 years
Unemployment Among Women with Children Under 6 years Comparison
Immigrants from Argentina
Pima
7.5%
UNEMPLOYMENT AMONG WOMEN WITH CHILDREN UNDER 6 YEARS
81.5/ 100
METRIC RATING
142nd/ 347
METRIC RANK
13.4%
UNEMPLOYMENT AMONG WOMEN WITH CHILDREN UNDER 6 YEARS
0.0/ 100
METRIC RATING
338th/ 347
METRIC RANK
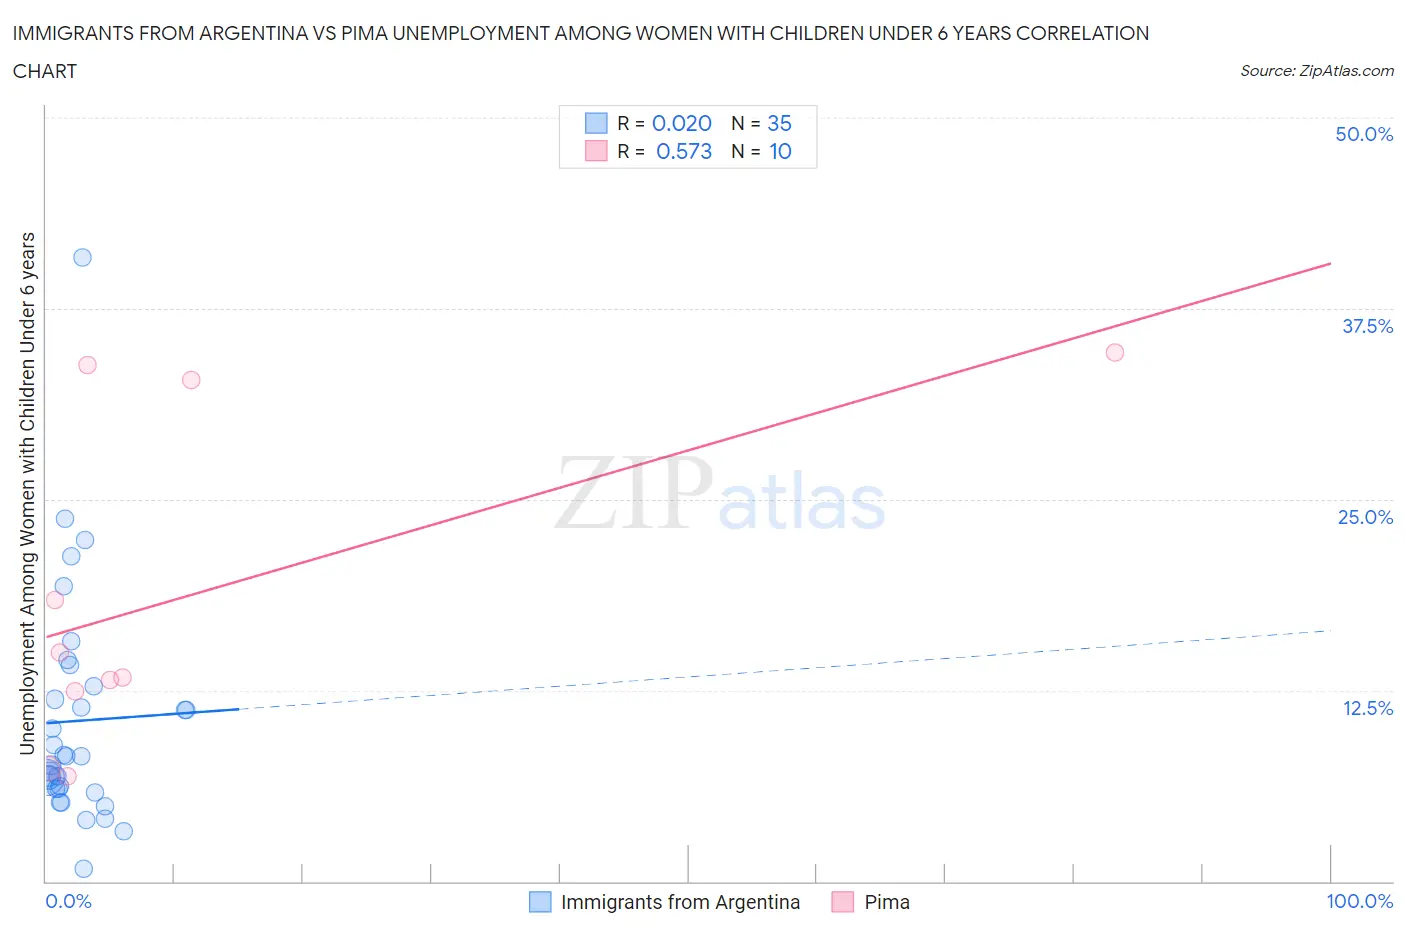
Immigrants from Argentina vs Pima Unemployment Among Women with Children Under 6 years Correlation Chart
The statistical analysis conducted on geographies consisting of 215,800,646 people shows no correlation between the proportion of Immigrants from Argentina and unemployment rate among women with children under the age of 6 in the United States with a correlation coefficient (R) of 0.020 and weighted average of 7.5%. Similarly, the statistical analysis conducted on geographies consisting of 58,117,266 people shows a substantial positive correlation between the proportion of Pima and unemployment rate among women with children under the age of 6 in the United States with a correlation coefficient (R) of 0.573 and weighted average of 13.4%, a difference of 80.2%.
Unemployment Among Women with Children Under 6 years Correlation Summary
| Measurement | Immigrants from Argentina | Pima |
| Minimum | 0.80% | 6.9% |
| Maximum | 40.8% | 34.6% |
| Range | 40.0% | 27.7% |
| Mean | 10.5% | 18.8% |
| Median | 8.2% | 14.2% |
| Interquartile 25% (IQ1) | 6.0% | 12.4% |
| Interquartile 75% (IQ3) | 12.8% | 32.8% |
| Interquartile Range (IQR) | 6.7% | 20.4% |
| Standard Deviation (Sample) | 7.6% | 10.8% |
| Standard Deviation (Population) | 7.5% | 10.3% |
Similar Demographics by Unemployment Among Women with Children Under 6 years
Demographics Similar to Immigrants from Argentina by Unemployment Among Women with Children Under 6 years
In terms of unemployment among women with children under 6 years, the demographic groups most similar to Immigrants from Argentina are Korean (7.5%, a difference of 0.020%), Greek (7.4%, a difference of 0.12%), Scandinavian (7.4%, a difference of 0.18%), European (7.5%, a difference of 0.25%), and Immigrants from Jordan (7.5%, a difference of 0.28%).
| Demographics | Rating | Rank | Unemployment Among Women with Children Under 6 years |
| Immigrants | Northern Africa | 85.3 /100 | #135 | Excellent 7.4% |
| Immigrants | Morocco | 84.9 /100 | #136 | Excellent 7.4% |
| Immigrants | Cambodia | 84.6 /100 | #137 | Excellent 7.4% |
| Immigrants | Norway | 84.1 /100 | #138 | Excellent 7.4% |
| Immigrants | Colombia | 83.9 /100 | #139 | Excellent 7.4% |
| Scandinavians | 83.0 /100 | #140 | Excellent 7.4% |
| Greeks | 82.6 /100 | #141 | Excellent 7.4% |
| Immigrants | Argentina | 81.5 /100 | #142 | Excellent 7.5% |
| Koreans | 81.3 /100 | #143 | Excellent 7.5% |
| Europeans | 79.1 /100 | #144 | Good 7.5% |
| Immigrants | Jordan | 78.9 /100 | #145 | Good 7.5% |
| Japanese | 78.9 /100 | #146 | Good 7.5% |
| Immigrants | Oceania | 78.4 /100 | #147 | Good 7.5% |
| Immigrants | Brazil | 77.3 /100 | #148 | Good 7.5% |
| Colombians | 76.1 /100 | #149 | Good 7.5% |
Demographics Similar to Pima by Unemployment Among Women with Children Under 6 years
In terms of unemployment among women with children under 6 years, the demographic groups most similar to Pima are Navajo (13.5%, a difference of 0.40%), Immigrants from Yemen (13.5%, a difference of 0.40%), Chippewa (13.3%, a difference of 0.79%), Shoshone (13.2%, a difference of 1.9%), and Lumbee (13.8%, a difference of 2.6%).
| Demographics | Rating | Rank | Unemployment Among Women with Children Under 6 years |
| Colville | 0.0 /100 | #331 | Tragic 11.2% |
| Sioux | 0.0 /100 | #332 | Tragic 11.5% |
| Natives/Alaskans | 0.0 /100 | #333 | Tragic 11.5% |
| Apache | 0.0 /100 | #334 | Tragic 12.3% |
| Puerto Ricans | 0.0 /100 | #335 | Tragic 12.5% |
| Shoshone | 0.0 /100 | #336 | Tragic 13.2% |
| Chippewa | 0.0 /100 | #337 | Tragic 13.3% |
| Pima | 0.0 /100 | #338 | Tragic 13.4% |
| Navajo | 0.0 /100 | #339 | Tragic 13.5% |
| Immigrants | Yemen | 0.0 /100 | #340 | Tragic 13.5% |
| Lumbee | 0.0 /100 | #341 | Tragic 13.8% |
| Yuman | 0.0 /100 | #342 | Tragic 14.6% |
| Crow | 0.0 /100 | #343 | Tragic 14.6% |
| Hopi | 0.0 /100 | #344 | Tragic 16.8% |
| Inupiat | 0.0 /100 | #345 | Tragic 17.7% |